Visualizations of PCM data
NOTICE: Downloads from FTP are currently disabled. We are working on restoring access.
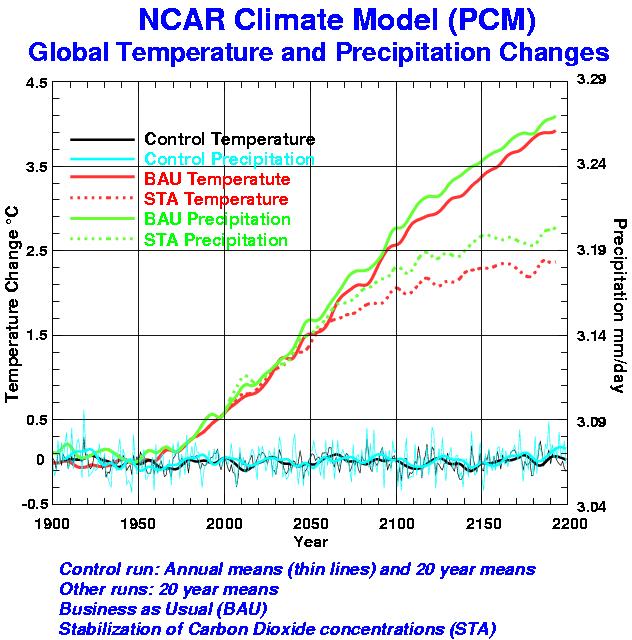
- Temperature and precipitation changes from BAU and
stabilization model runs, 1900-2100 (83 kB JPG).
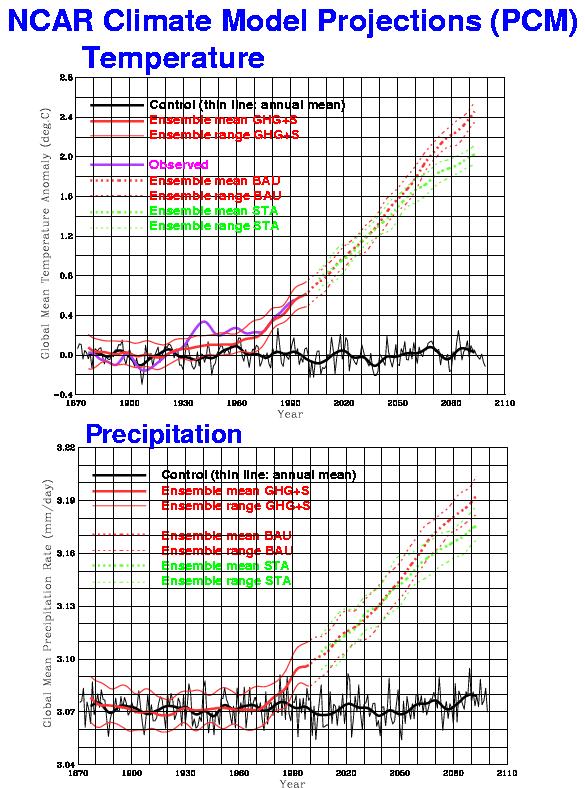
- Temperature and precipitation changes from ensemble
of BAU and stabilization model runs, 1870-2100 (122 kB JPG).
- (Currently unavailable)MPG animation of control run sea surface temperature anomalies over a 6.5 year period, sampled every three days. It shows El Ni˝o/La Ni˝a temperature patterns as well as current eddies and eastward-propagating waves.
- (Currently unavailable)MPG animation of a very high-resolution atmospheric model runs showing the cloud patterns the model calculates.
- (Currently unavailable)MPG animation of sea surface temperatures around the globe for about 8 years of monthly data.
- (Currently unavailable)MPG animation of air surface temperature changes given a doubling of CO2 concentration in the atmosphere.
- PostScript version of PCM model component schematic.
- Depiction of increasing atmospheric model resolution for the whole globe, illustrating grid box size and topography. Gzip-ped encapsulated postscript version of this image is available here.
- Depiction of increasing atmospheric model resolution for US land areas, illustrating topography. Gzip-ped encapsulated postscript version of this image is available here.
Other visualizations can be found at this
website.