Output for ILAMB Diagnostics
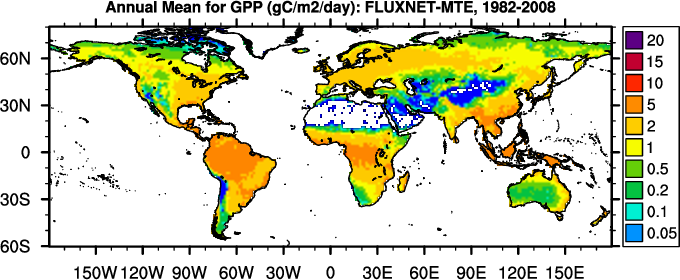
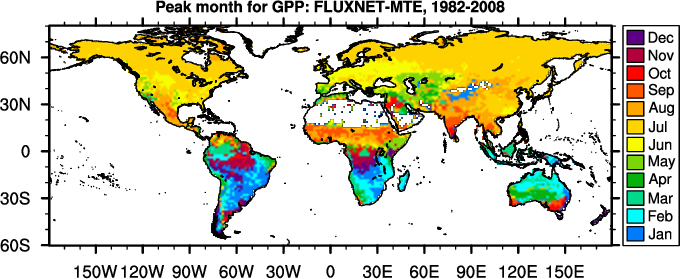
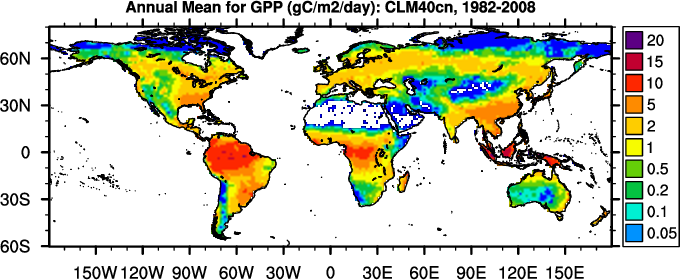
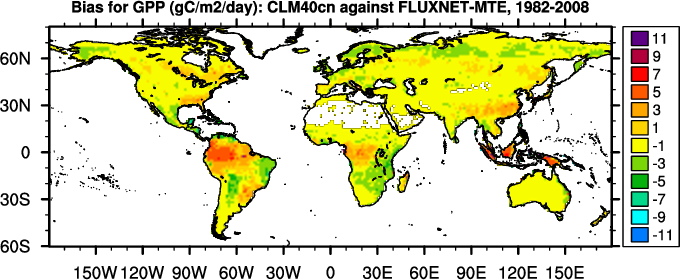
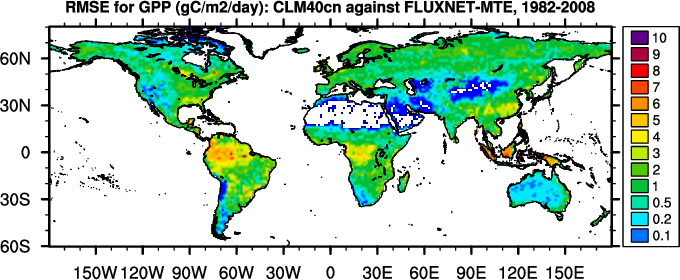
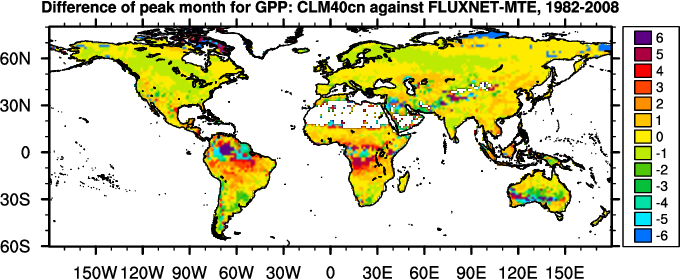
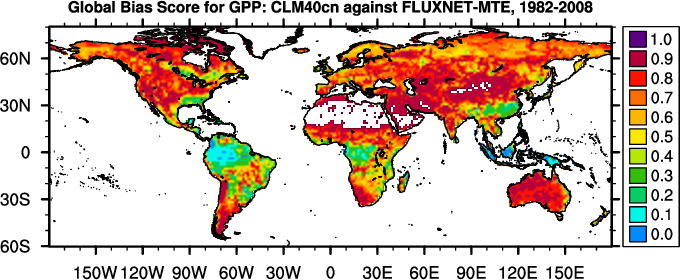
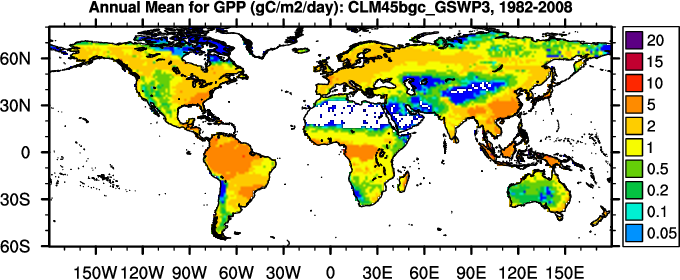
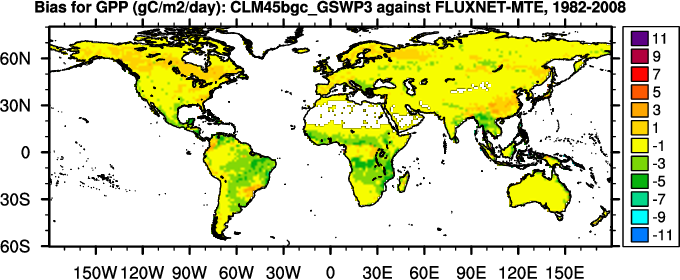
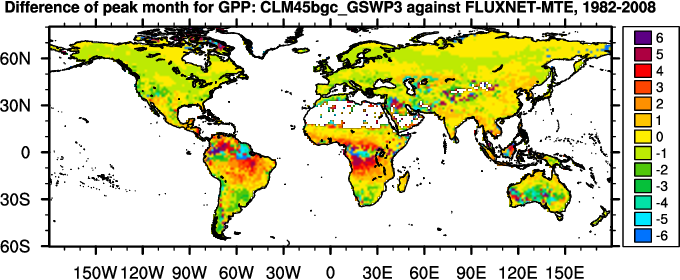
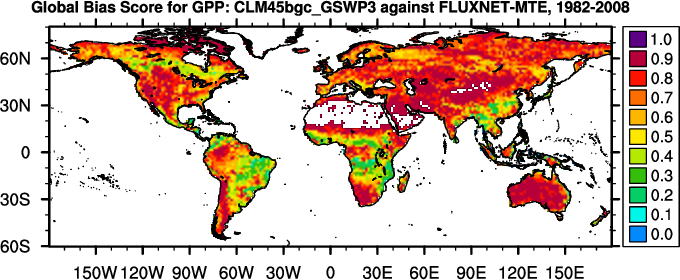
Diagnostic Summary for Gross Primary Productivity: Model vs. FLUXNET-MTE
Global Patterns
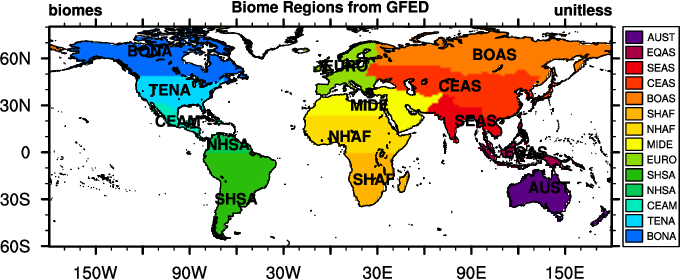
Regional Patterns
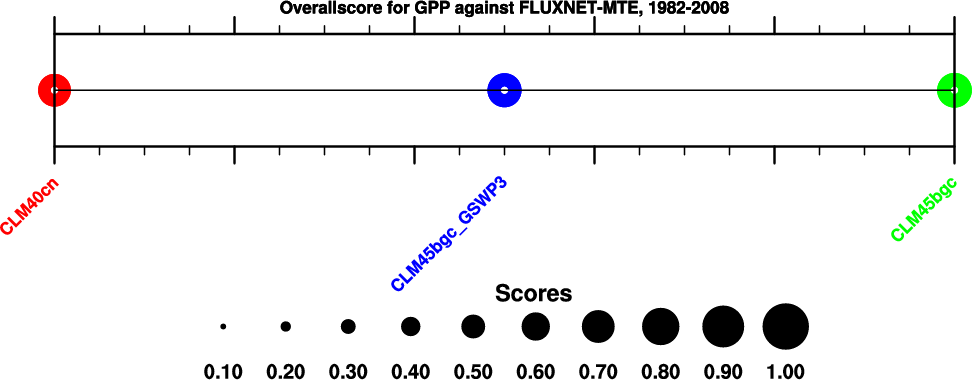
Scoring
(
Info
)
Annual Mean (PgC/yr)
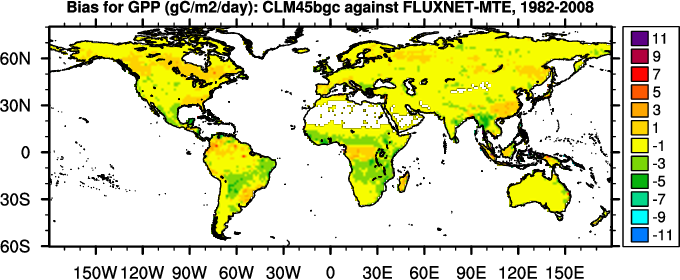
Bias (PgC/yr)
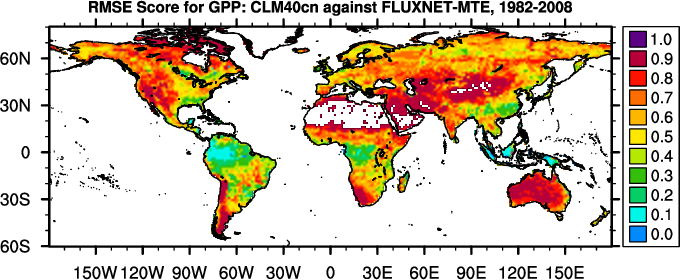
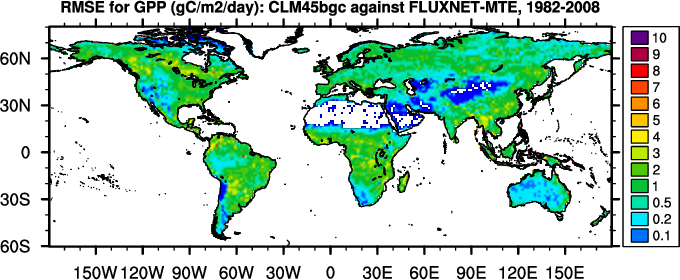
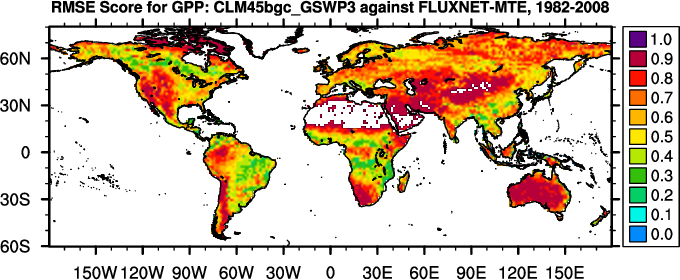
RMSE (PgC/mon)
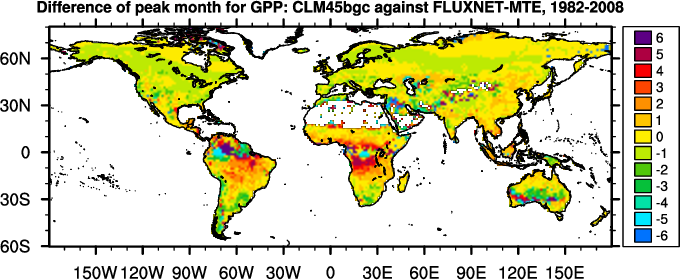
Phase Change (months)
Regional
Mean
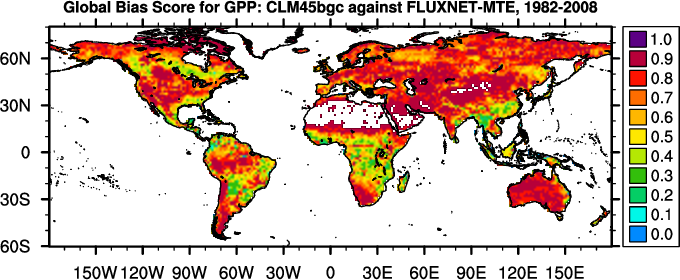
Global Bias
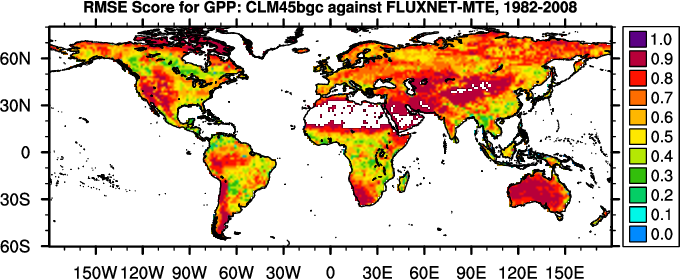
RMSE
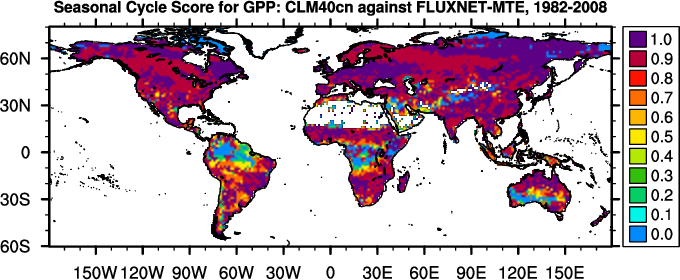
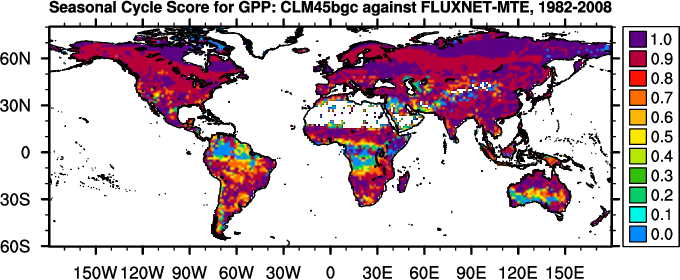
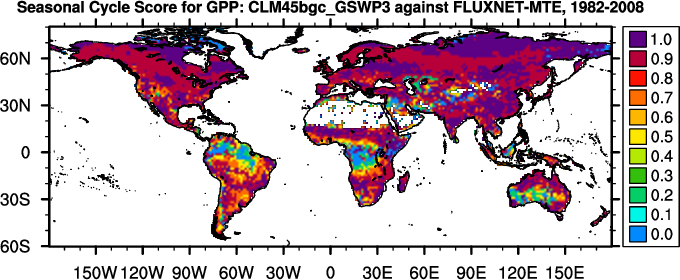
Seasonal Cycle
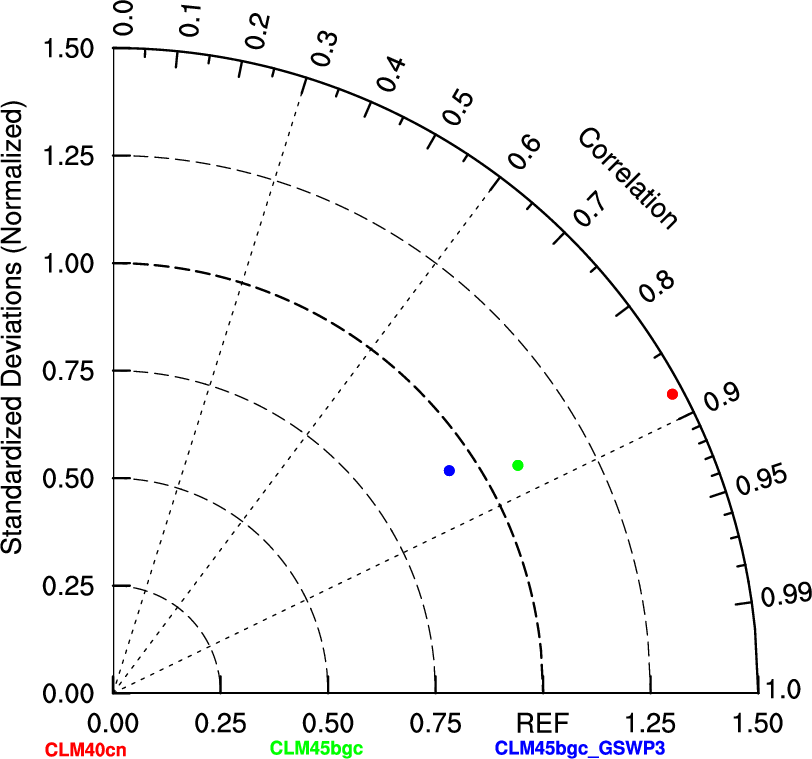
Spatial Distribution
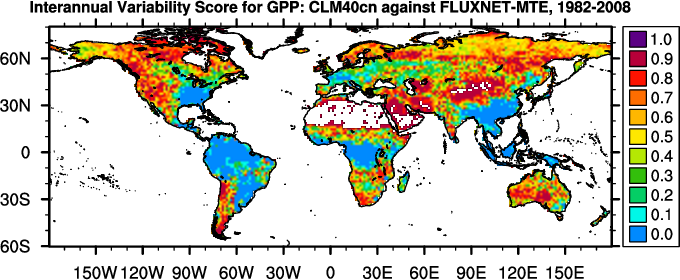
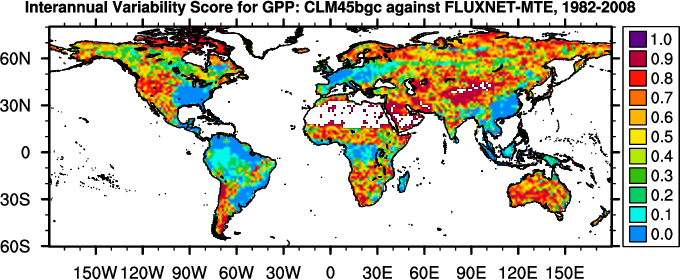
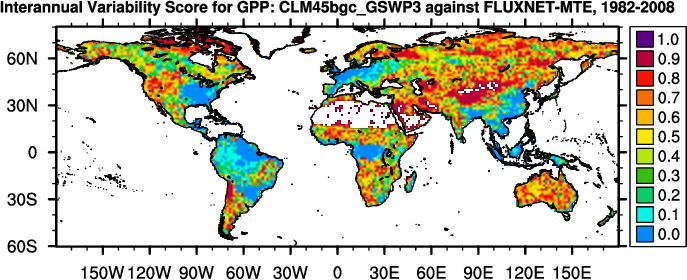
Interannual Variability
Overall
Benchmark
[Jung et al. (2010)]
118.5
-
-
0.0
access to
plots
-
-
-
-
-
-
CLM40cn
128.5
9.9
5.8
0.1
access to
plots
0.71
0.67
0.83
0.81
0.50
0.70
CLM45bgc
113.8
-4.7
4.8
0.0
access to
plots
0.76
0.71
0.83
0.93
0.51
0.74
CLM45bgc_GSWP3
105.9
-12.6
5.0
-0.0
access to
plots
0.74
0.70
0.82
0.91
0.50
0.73
Notes: In calculating overall score, rmse score contributes double in comparison with all other scores.