| Metric Document, Scoring Metrics, Data, Model and Overall Diagnostic Information |
| Metric Document | Rules for Scoring System | Scoring Metrics, Data and Overall Info | Model Data Availability |
| Click Here | Click Here | Click Here | Click Here |
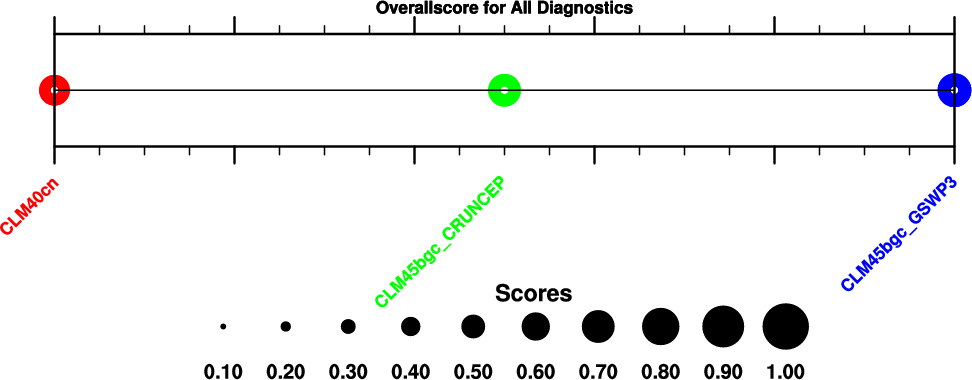
| Overall Scores |
|
|
|
|||||
|
|
|
|
||||
|
|
|
|
||||
|
|
|
|
| Global Variables (Info for Weightings) |
|
|
|
|||||
|
|
|
|
||||
|
|
|
|
||||
|
|
|
|
||||
|
|
|
|
||||
|
|
|
|
||||
|
|
|
|
||||
|
|
|
|
||||
|
|
|
|
||||
|
|
|
|
||||
|
|
|
|
||||
|
|
|
|
||||
|
|
|
|
||||
|
|
|
|
||||
|
|
|
|
||||
|
|
|
|
||||
|
|
|
|
||||
|
|
|
|
||||
|
|
|
|
||||
|
|
|
|
||||
|
|
|
|
||||
|
|
|
|
||||
|
|
|
|
||||
|
|
|
|
||||
|
|
|
|
||||
|
|
|
|
||||
|
|
|
|
||||
|
|
|
|
| Notes: 4 Categories are divided: Ecosystem and Carbon Cycle, Hydrology Cycle, Radiation and Energy Cycle, and Forcings. |
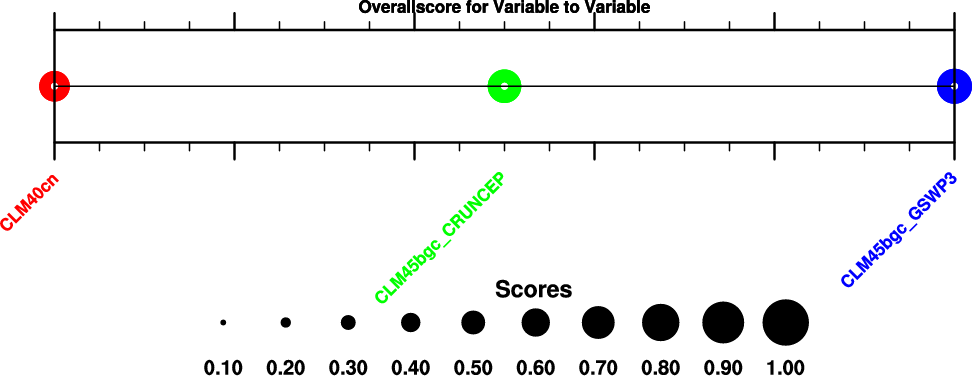
| Variable to Variable Relationships (Info for Weightings) |
|
|
|
|
|
|||||||
|
|
|
|
|
|
||||||
|
|
|
|
|
|
||||||
|
|
|
|
|
|
||||||
|
|
|
|
|
|
||||||
|
|
|
|
|
|
||||||
|
|
|
|
|
|
||||||
|
|
|
|
|
|
||||||
|
|
|
|
|
|
||||||
|
|
|
|
|
|
||||||
|
|
|
|
|
|
||||||
|
|
|
|
|