Output for ILAMB Diagnostics
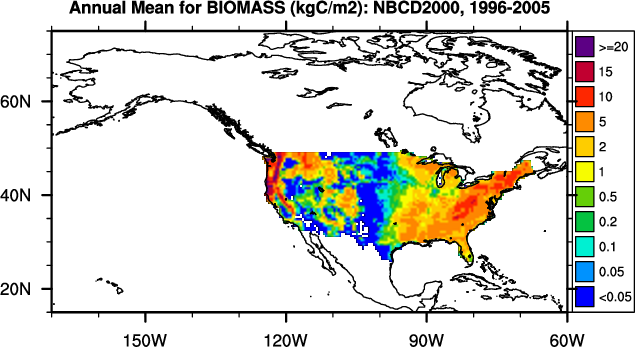
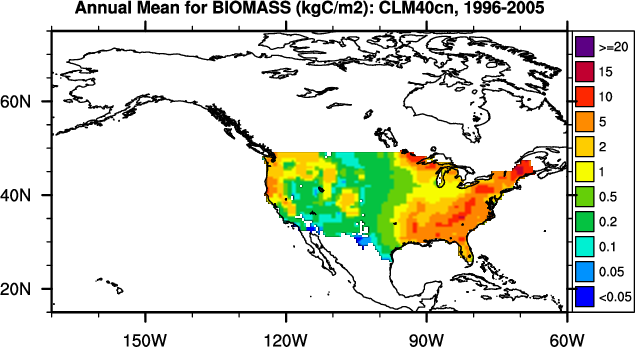
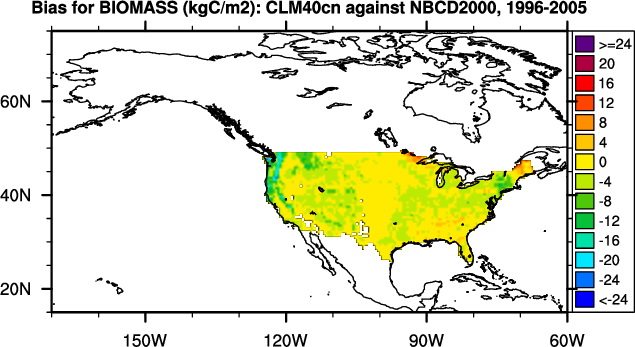
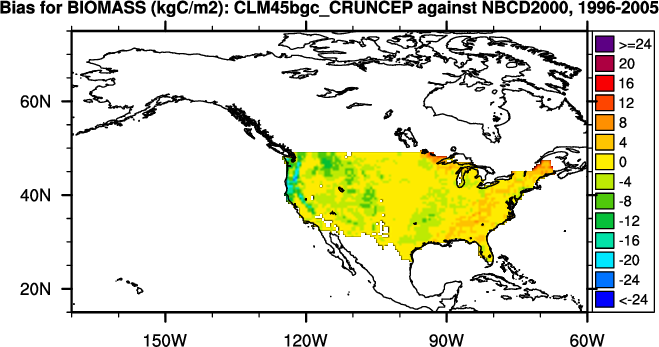
Diagnostic Summary for Aboveground Live Biomass: Model vs. NBCD2000
Global Patterns
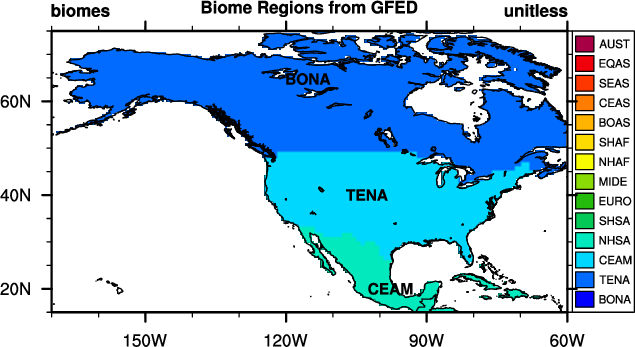
Regional Patterns
Scoring
(
Info
)
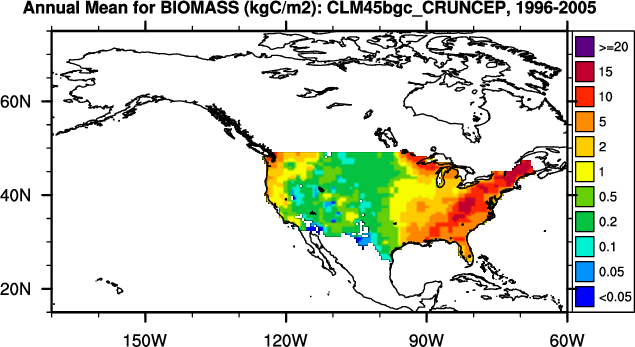
Annual Mean (PgC)
Bias (PgC)
Regional
Mean
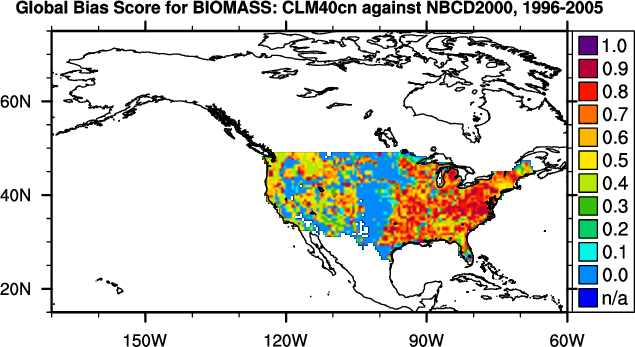
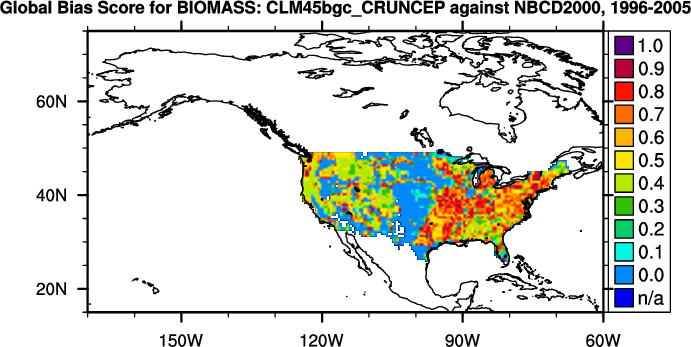
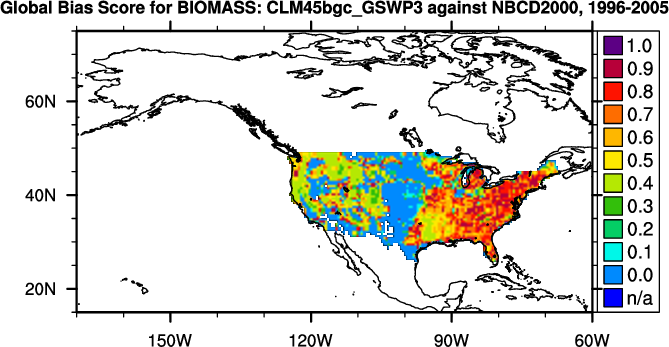
Global Bias
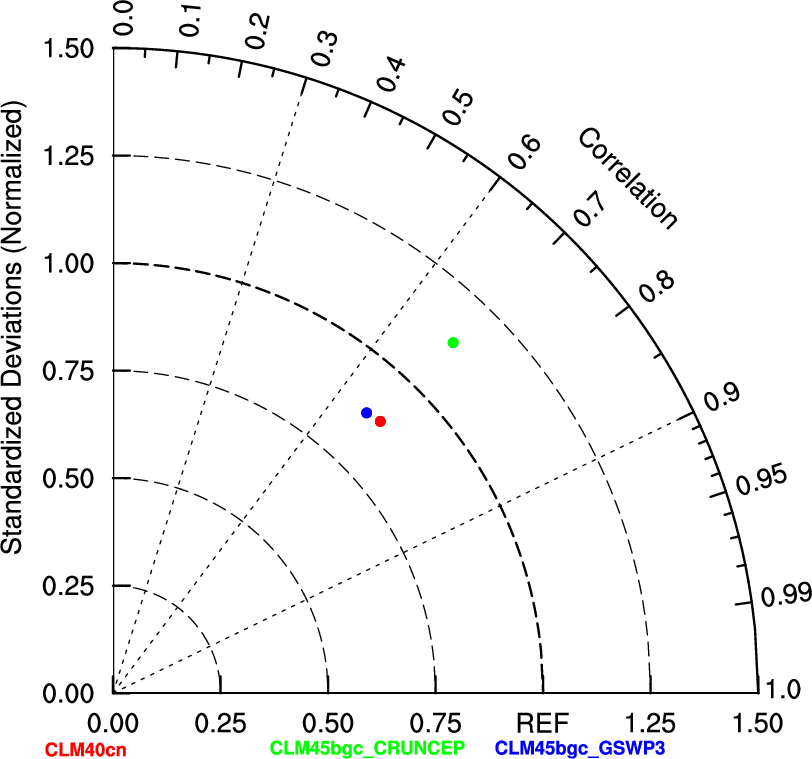
Spatial Distribution
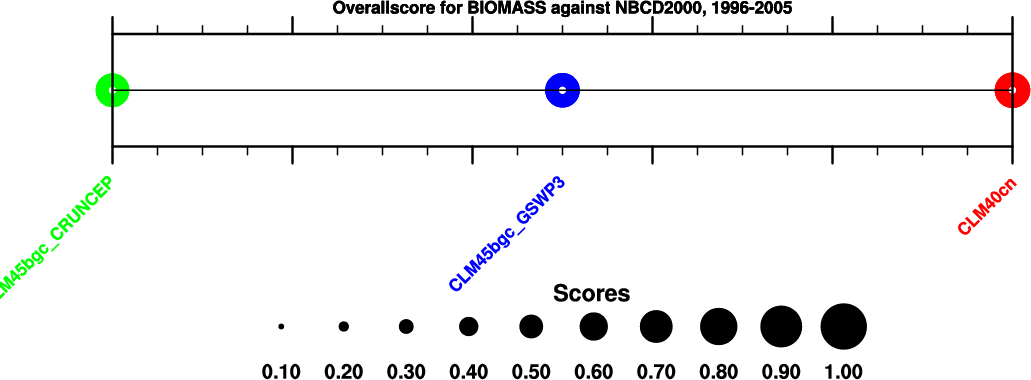
Overall
Benchmark
[Kellndorfer et al. (2000)]
26.2
-
access to
plots
-
-
-
CLM40cn
24.7
-1.5
access to
plots
0.68
0.84
0.76
CLM45bgc_CRUNCEP
29.3
3.1
access to
plots
0.61
0.83
0.72
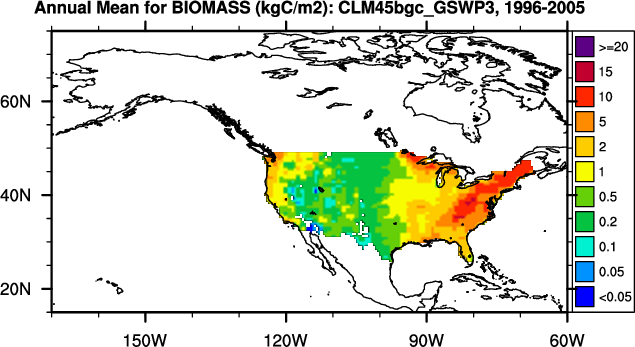
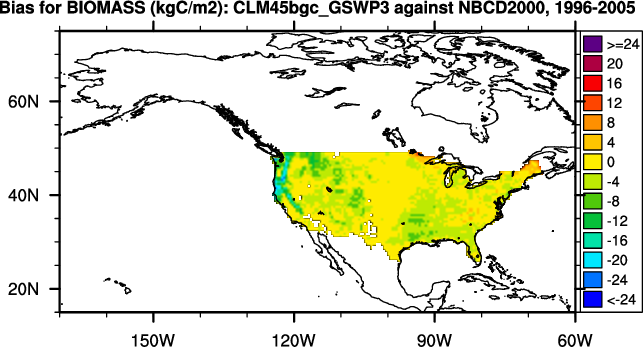
CLM45bgc_GSWP3
22.5
-3.7
access to
plots
0.66
0.82
0.74
Notes: In calculating overall score, rmse score contributes double in comparison with all other scores.