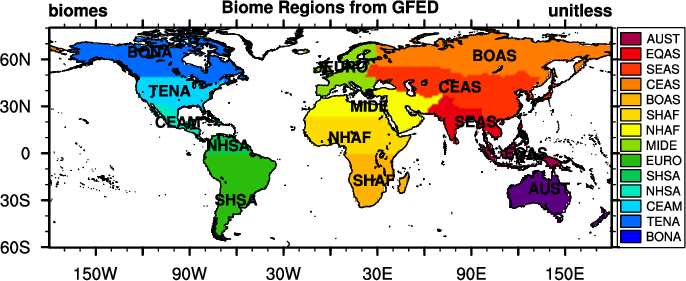
Output for ILAMB Diagnostics
Diagnostic Summary for Gross Primary Productivity: Model vs. FLUXNET
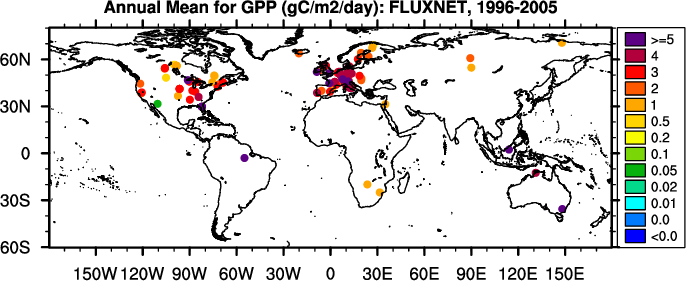
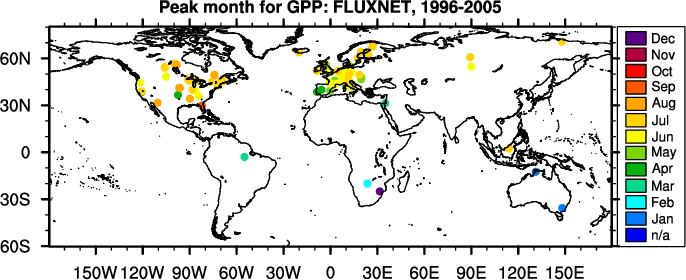
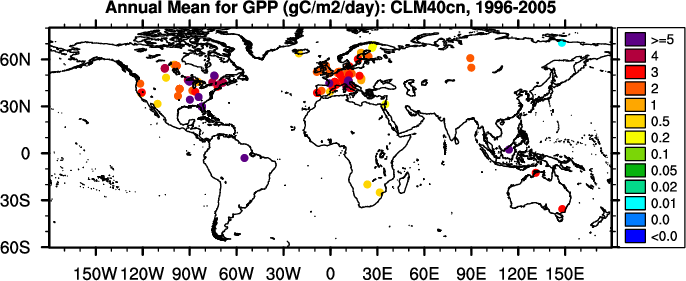
Global Patterns
Regional Patterns
Scoring
(
Info
)
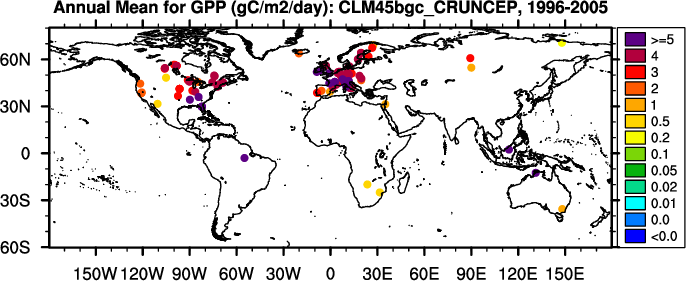
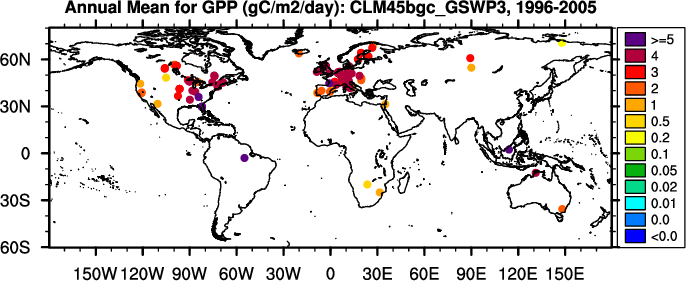
Annual Mean (gC/m2/day)
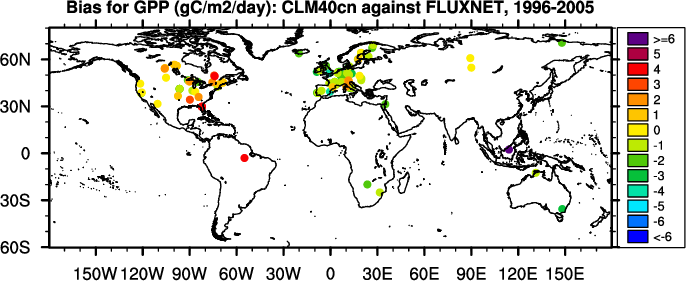
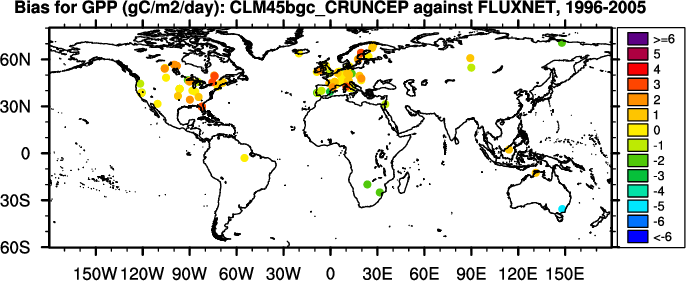
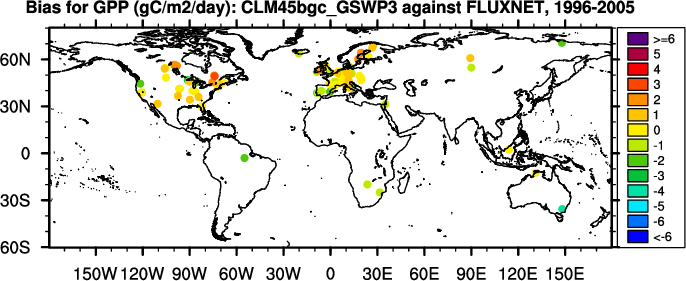
Bias (gC/m2/day)
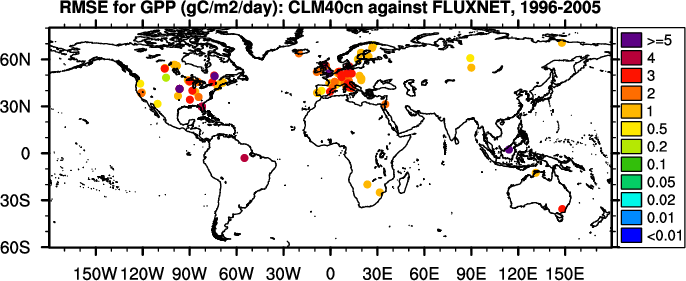
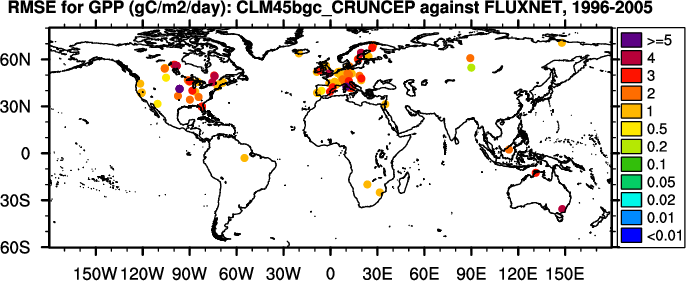
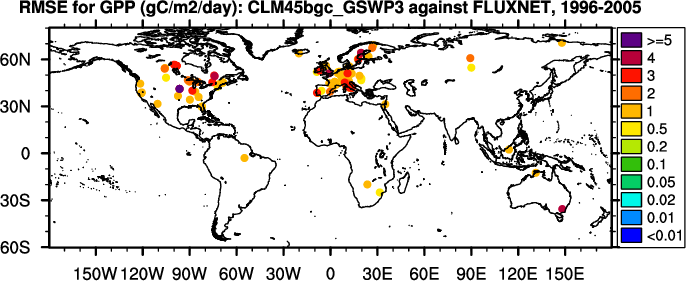
RMSE (gC/m2/day)
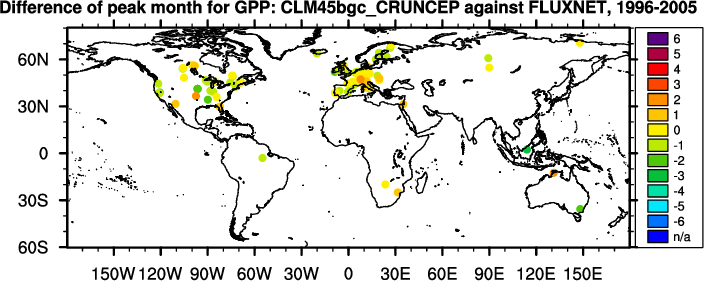
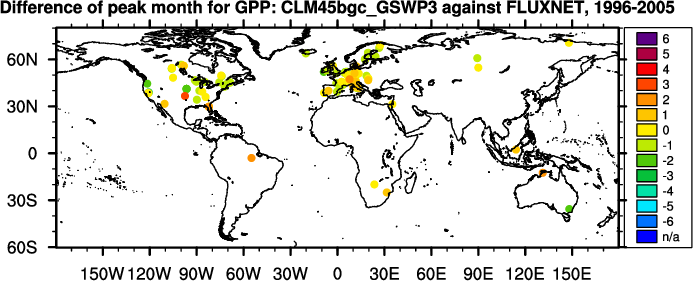
Phase Difference (months)
Regional
Mean
Individual Site
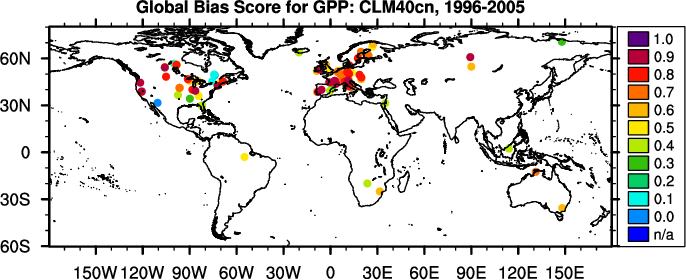
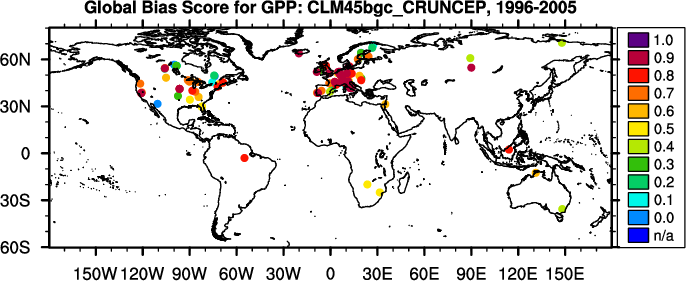
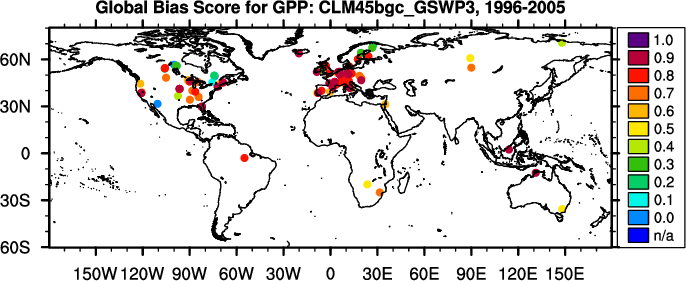
Global Bias
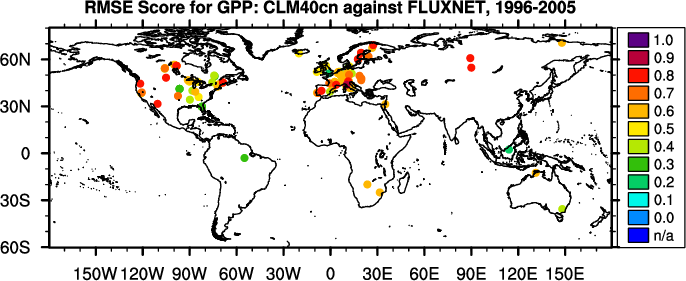
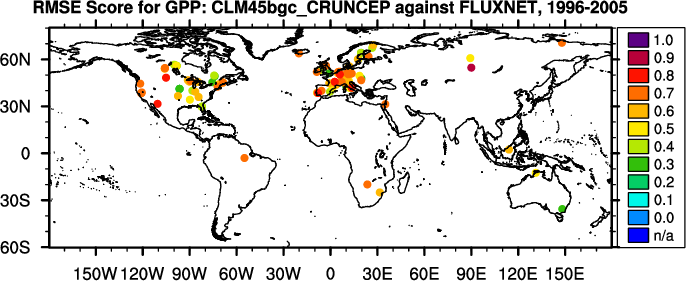
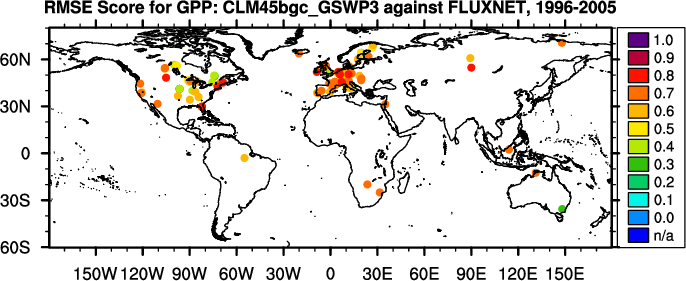
RMSE
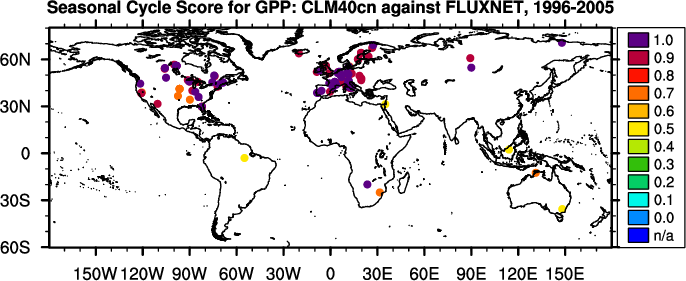
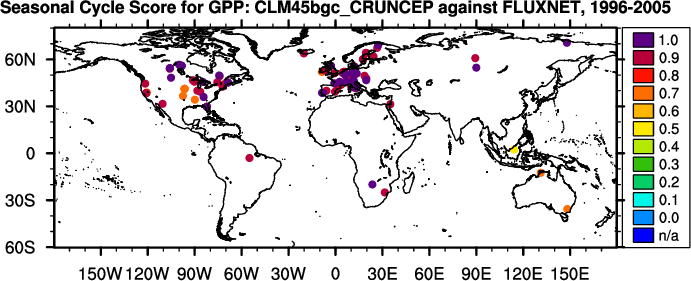
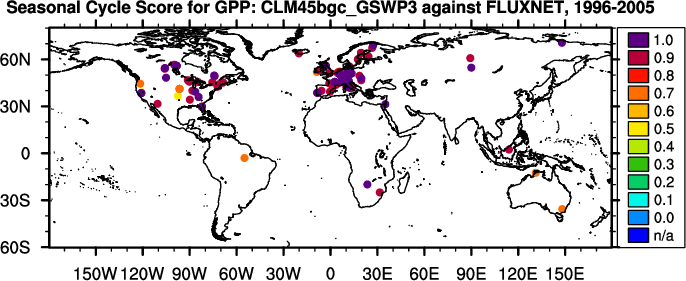
Seasonal Cycle
Spatial Distribution
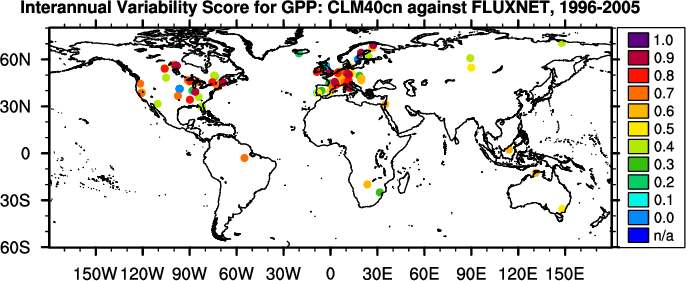
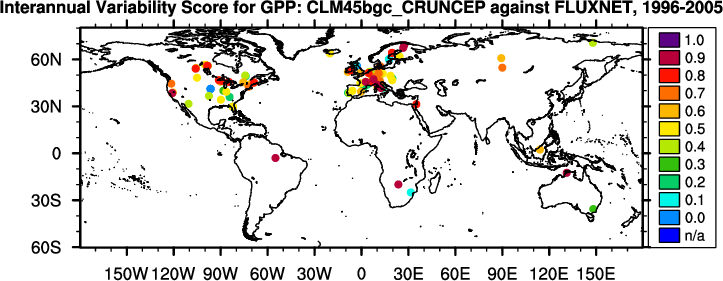
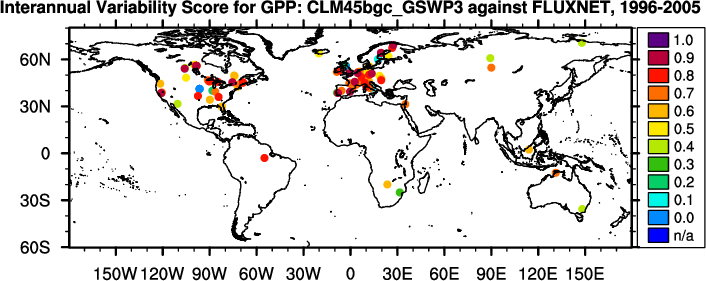
Interannual Variability
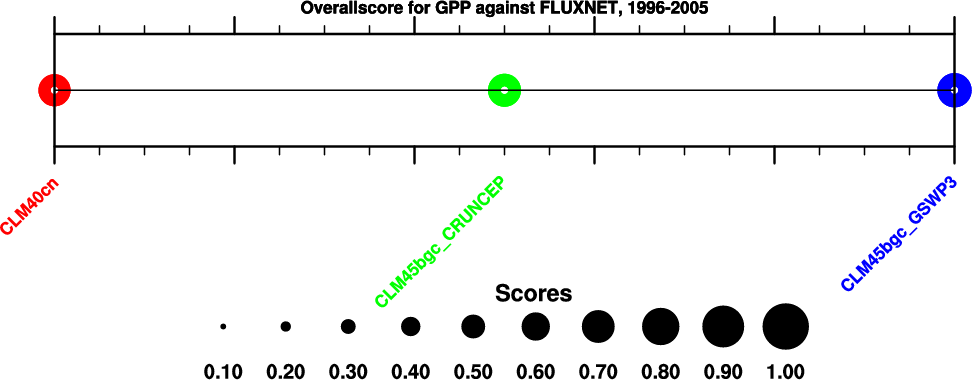
Overall
Benchmark
[Lasslop et al. (2010)]
3.26
-
-
0.00
access to
plots
access to
plots
-
-
-
-
-
-
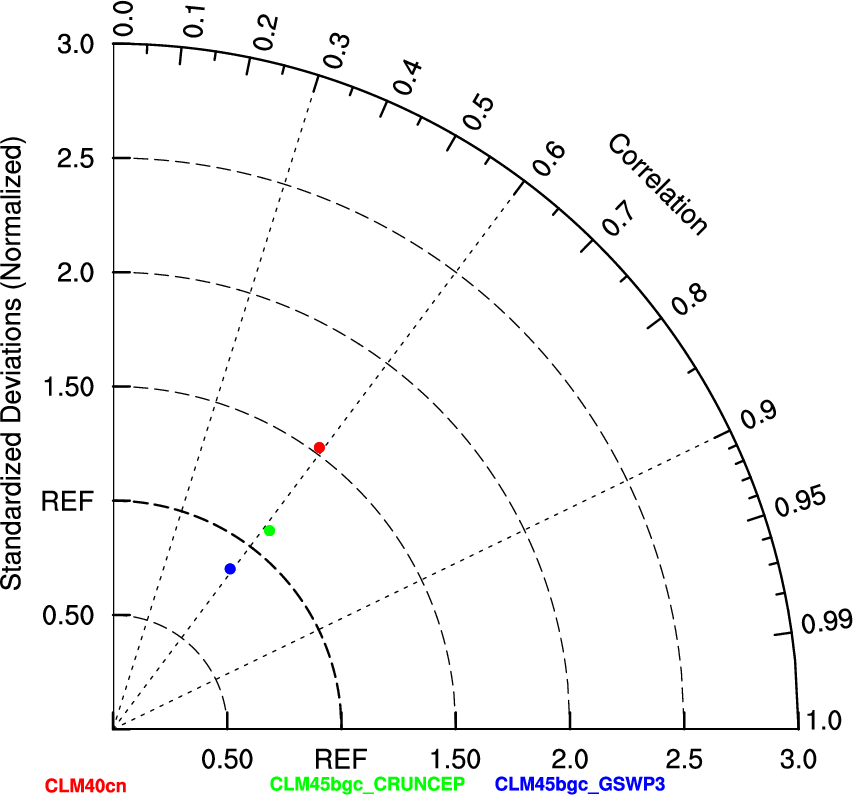
CLM40cn
3.32
0.07
2.31
-0.17
access to
plots
access to
plots
0.69
0.61
0.92
0.67
0.61
0.69
CLM45bgc_CRUNCEP
4.17
0.92
2.38
-0.47
access to
plots
access to
plots
0.73
0.60
0.93
0.80
0.57
0.70
CLM45bgc_GSWP3
3.68
0.42
2.02
-0.38
access to
plots
access to
plots
0.78
0.64
0.93
0.78
0.63
0.73
Notes: In calculating overall score, rmse score contributes double in comparison with all other scores.