Output for ILAMB Diagnostics
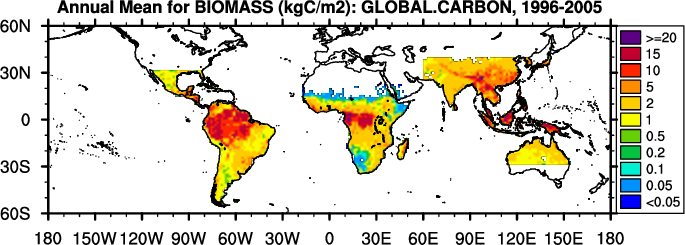
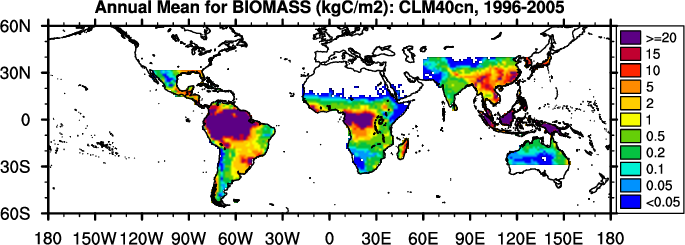
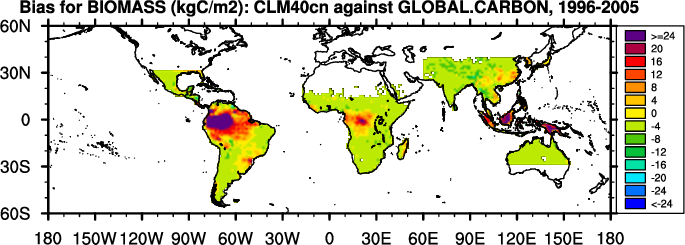
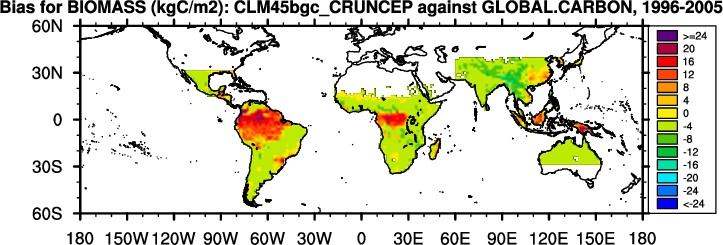
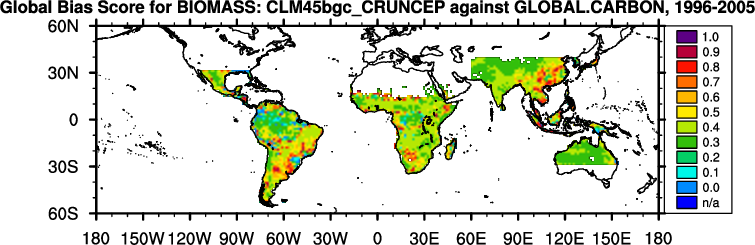
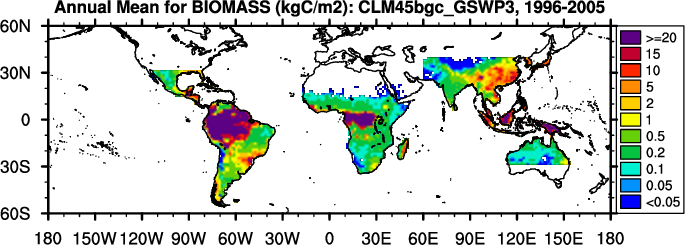
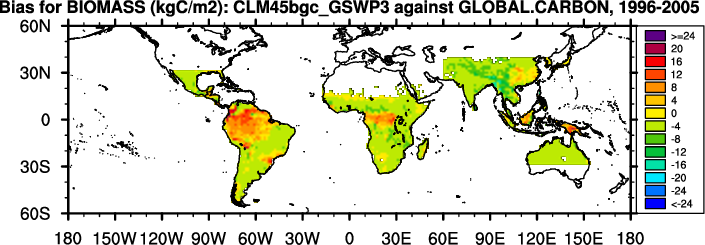
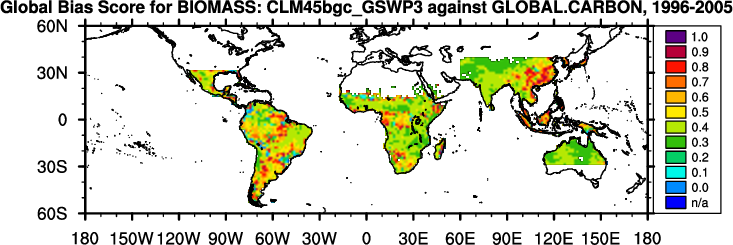
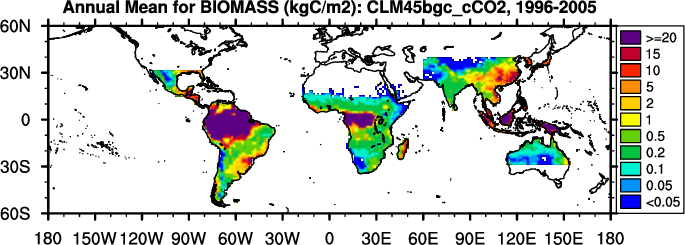
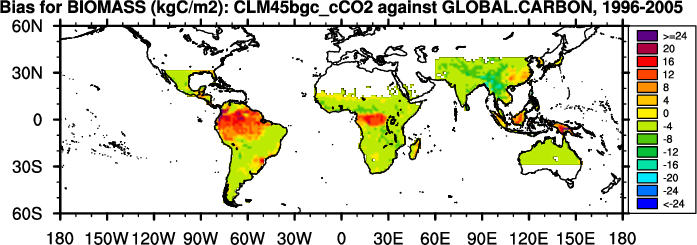
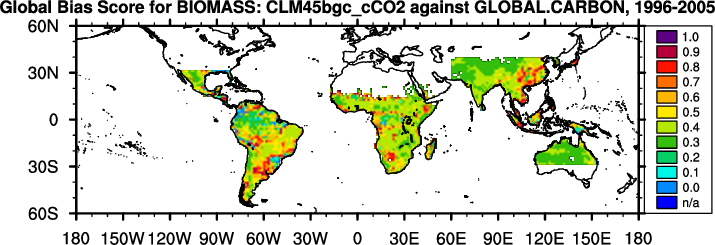
Diagnostic Summary for Aboveground Live Biomass: Model vs. GLOBAL.CARBON
Global Patterns
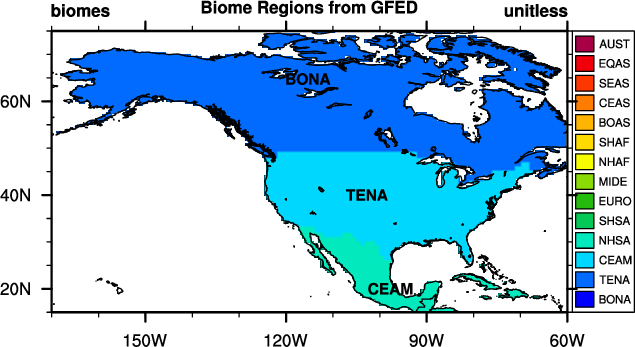
Regional Patterns
Scoring
(
Info
)
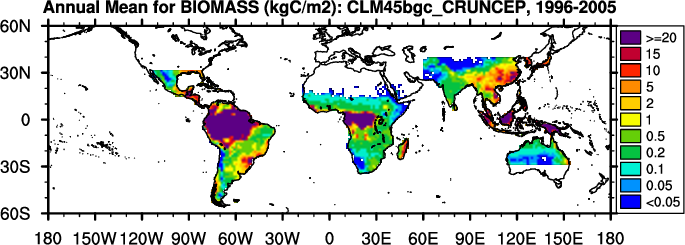
Annual Mean (PgC)
Bias (PgC)
Regional
Mean
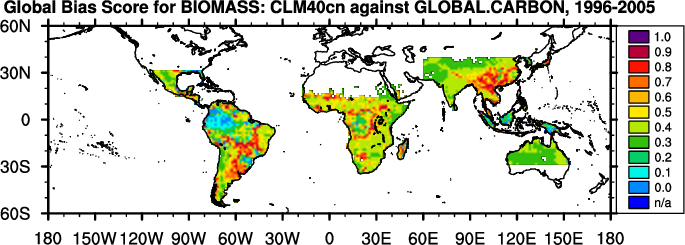
Global Bias
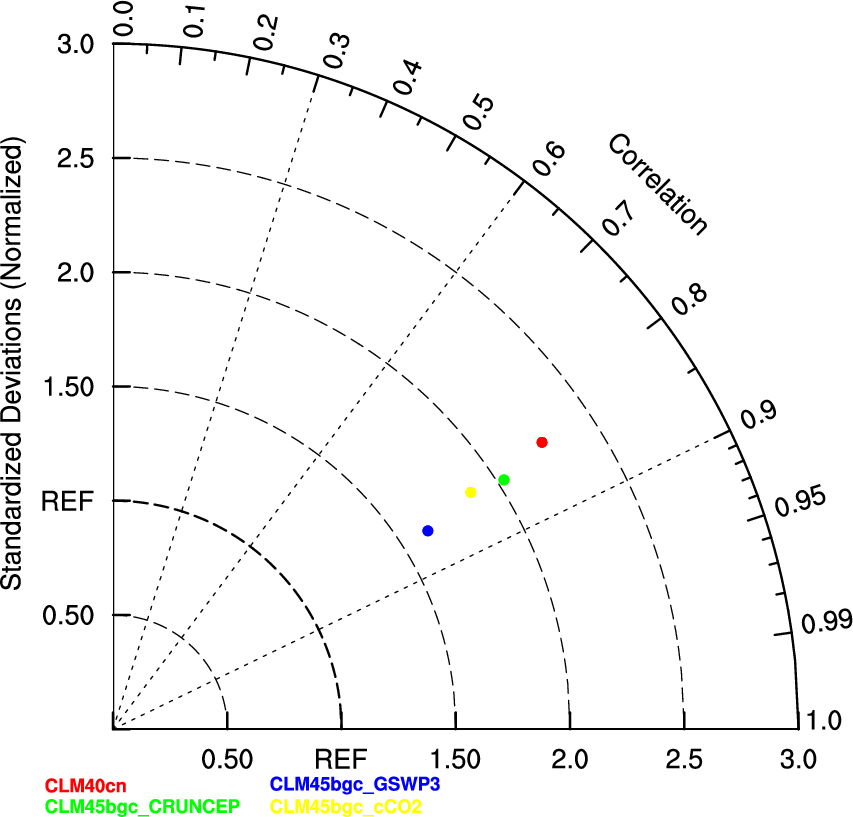
Spatial Distribution
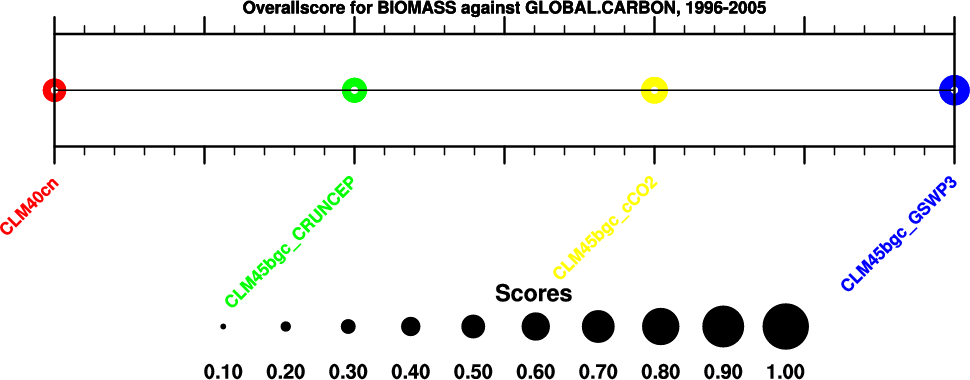
Overall
Benchmark
[Saatchi et al. (2011)]
351.4
-
access to
plots
-
-
-
CLM40cn
483.9
132.4
access to
plots
0.48
0.50
0.49
CLM45bgc_CRUNCEP
437.2
85.8
access to
plots
0.47
0.58
0.52
CLM45bgc_GSWP3
354.6
3.2
access to
plots
0.56
0.73
0.64
CLM45bgc_cCO2
398.9
47.4
access to
plots
0.50
0.63
0.56
Notes: In calculating overall score, rmse score contributes double in comparison with all other scores.