Output for ILAMB Diagnostics
Diagnostic Summary for Burned Area: Model vs. GFED3
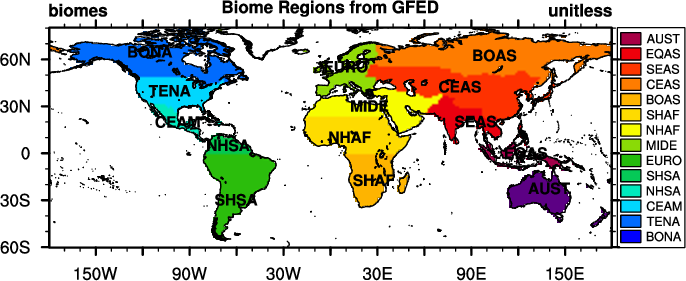
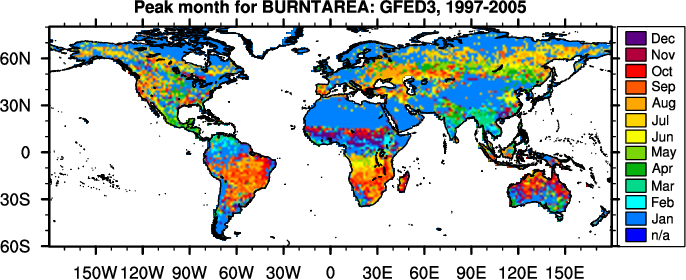
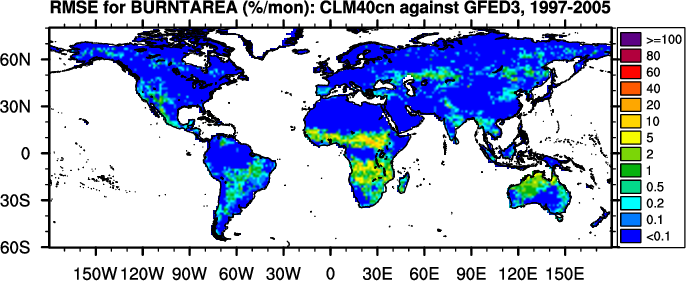
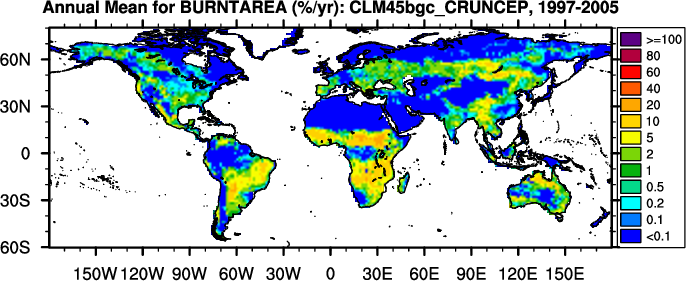
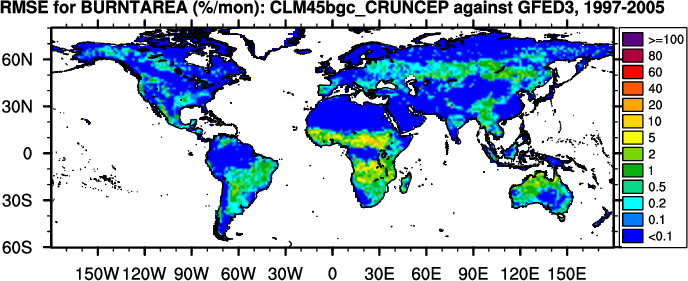
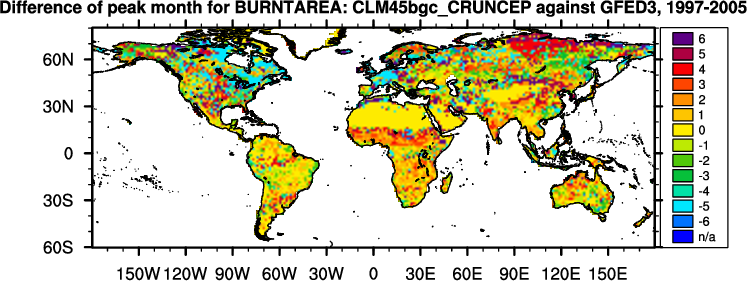
Global Patterns
Regional Patterns
Scoring
(
Info
)
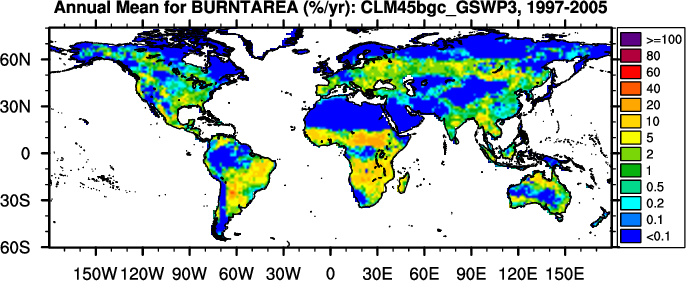
Annual Mean (Mha/yr)
Bias (Mha/yr)
RMSE (Mha/mon)
Phase Difference (months)
Regional
Mean
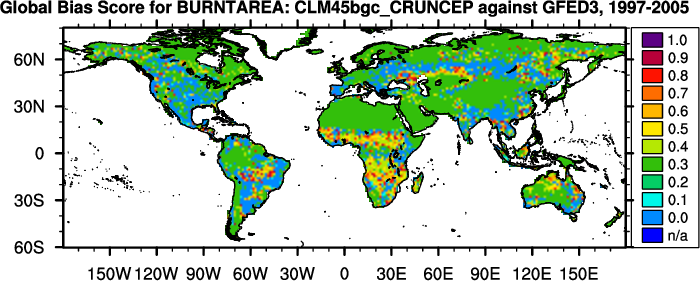
Global Bias
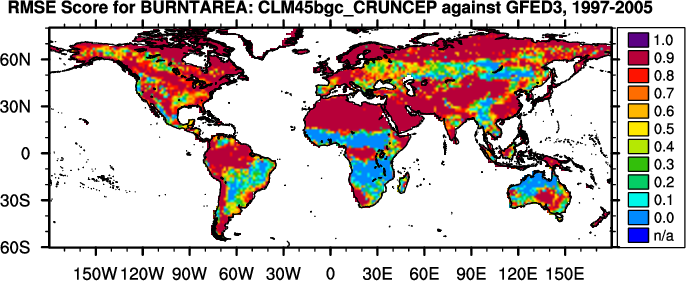
RMSE
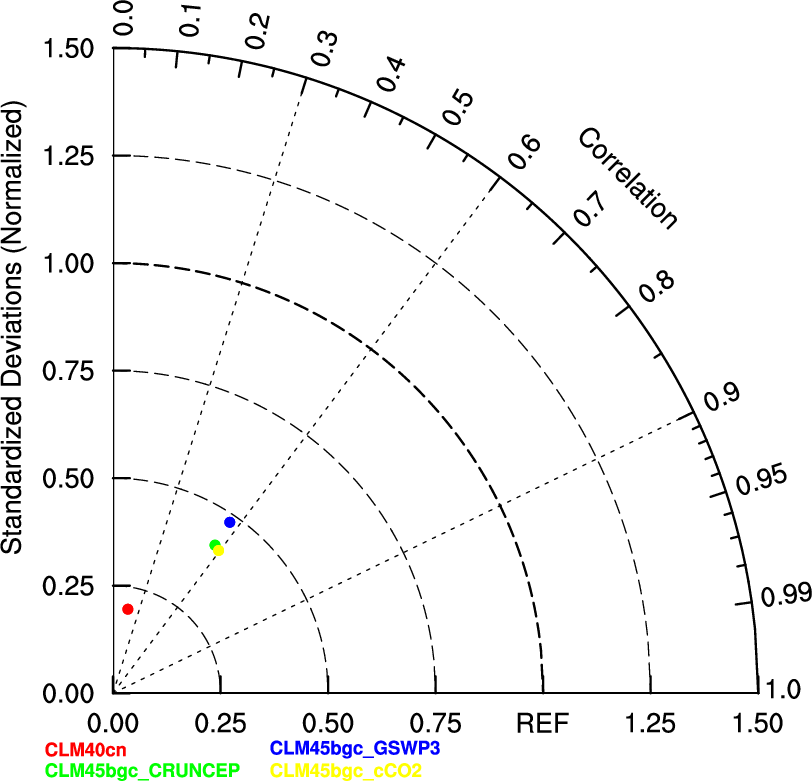
Seasonal Cycle
Spatial Distribution
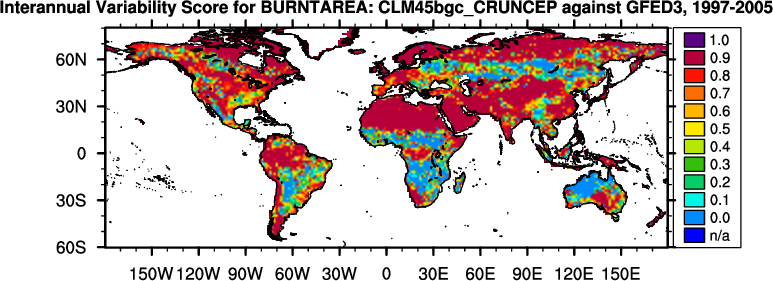
Interannual Variability
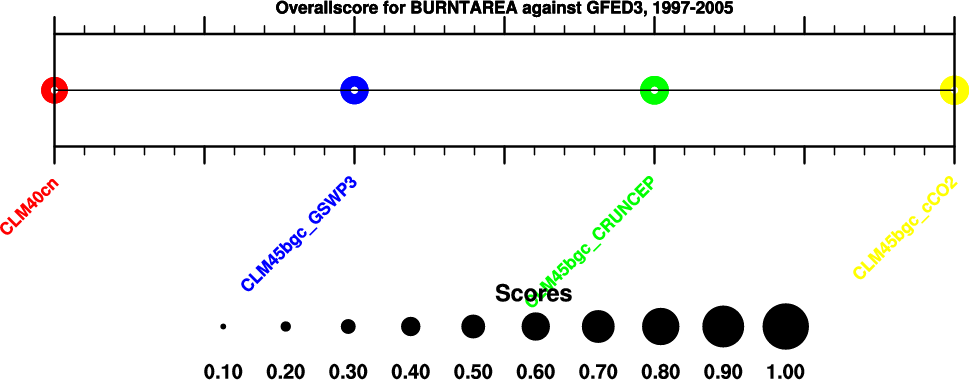
Overall
Benchmark
[Giglio et al. (2010)]
379.6
-
-
0.0
access to
plots
-
-
-
-
-
-
CLM40cn
130.6
-248.9
67.3
0.5
access to
plots
0.41
0.75
0.64
0.09
0.74
0.56
CLM45bgc_CRUNCEP
303.0
-76.5
77.5
0.3
access to
plots
0.51
0.69
0.67
0.40
0.69
0.61
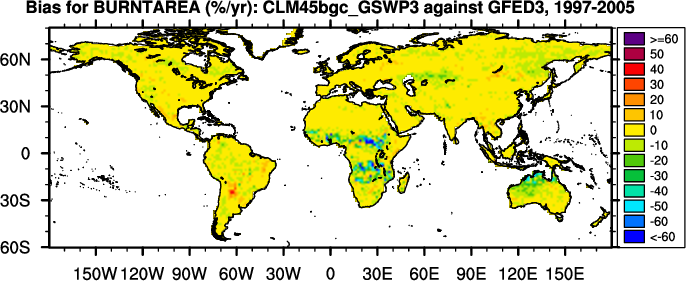
CLM45bgc_GSWP3
372.5
-7.1
87.4
0.3
access to
plots
0.52
0.64
0.65
0.48
0.64
0.59
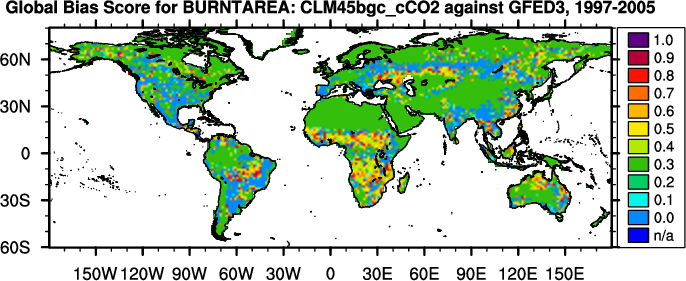
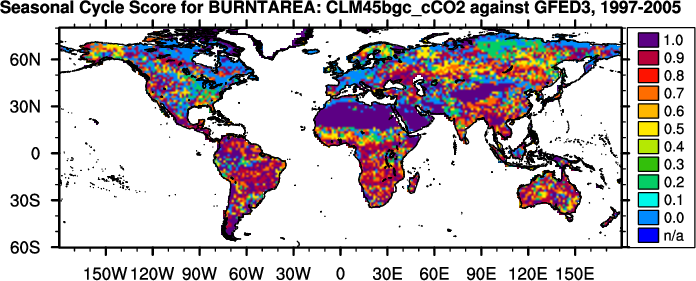
CLM45bgc_cCO2
268.9
-110.6
72.1
0.2
access to
plots
0.51
0.71
0.68
0.40
0.71
0.62
Notes: In calculating overall score, rmse score contributes double in comparison with all other scores.