Output for ILAMB Diagnostics
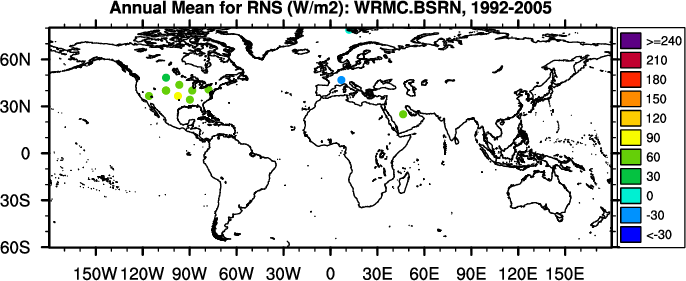
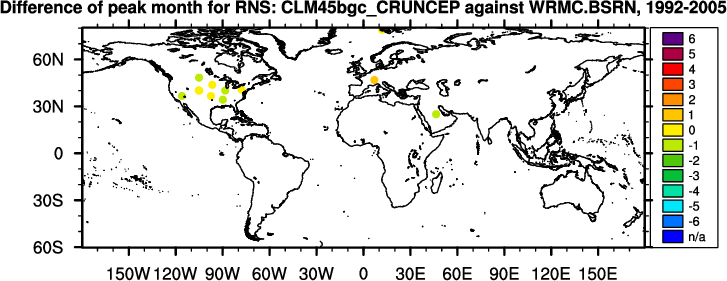
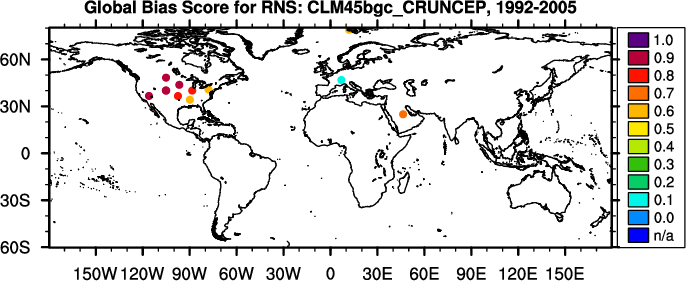
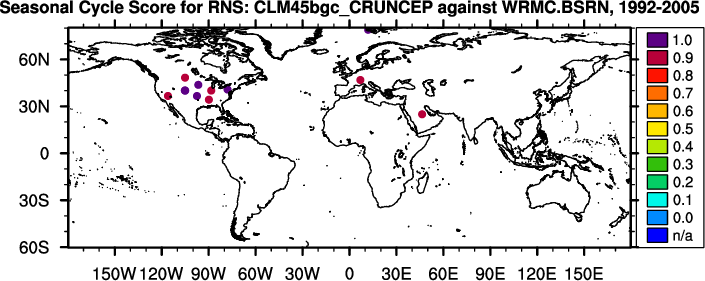
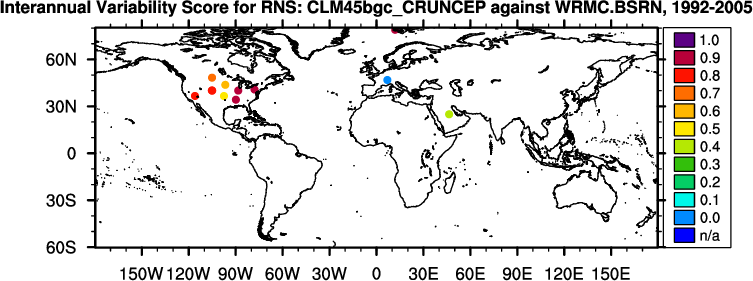
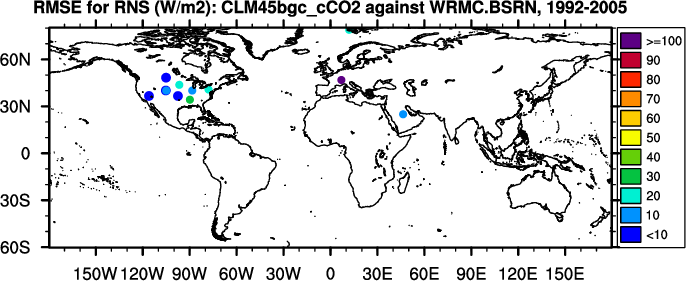
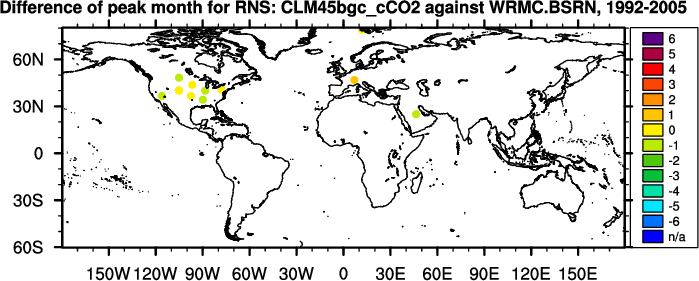
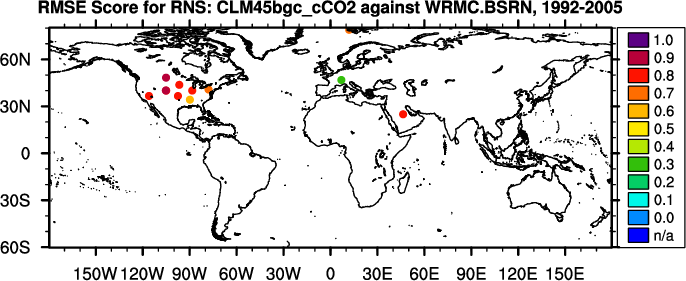
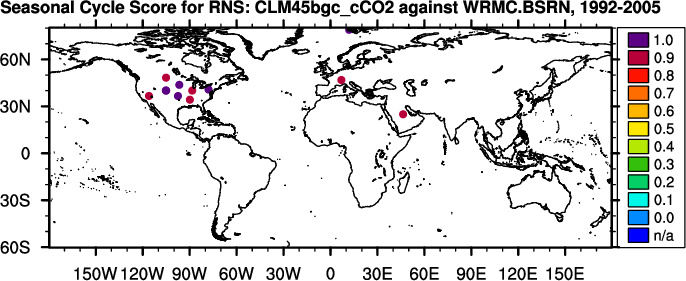
Diagnostic Summary for Surface Net Radiation: Model vs. WRMC.BSRN
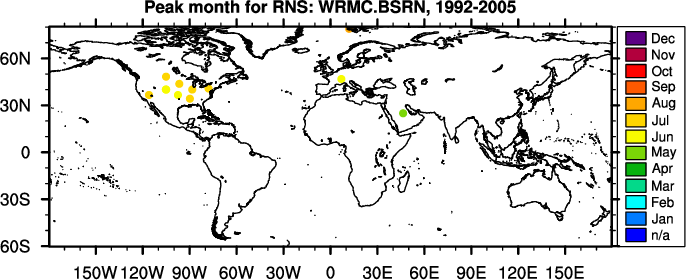
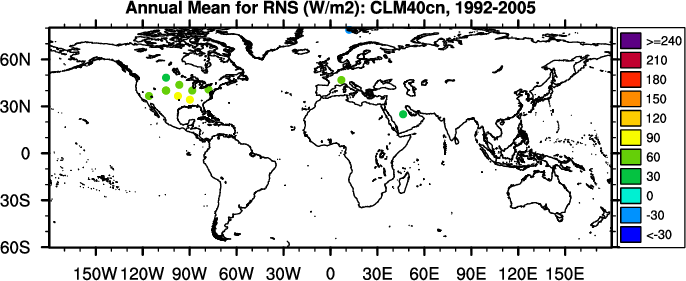
Global Patterns
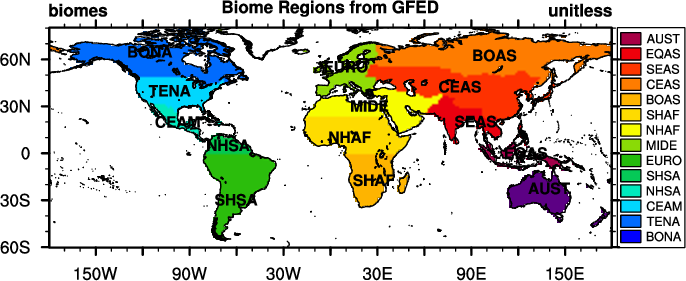
Regional Patterns
Scoring
(
Info
)
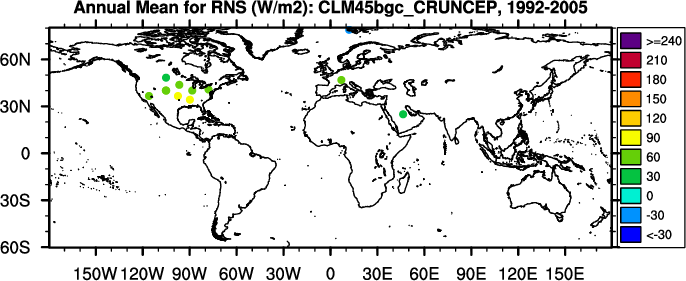
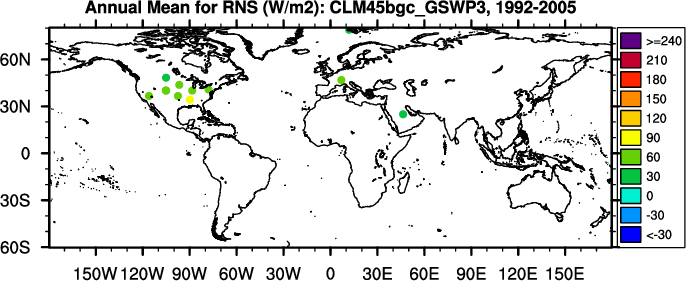
Annual Mean (W/m2)
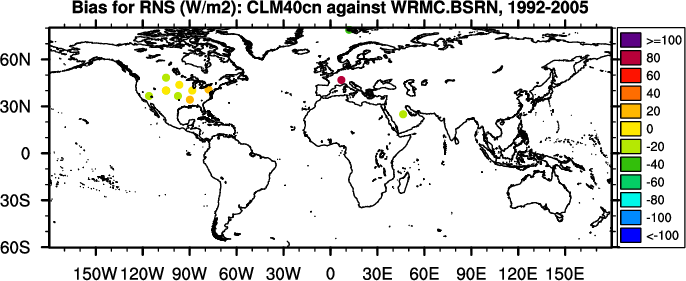
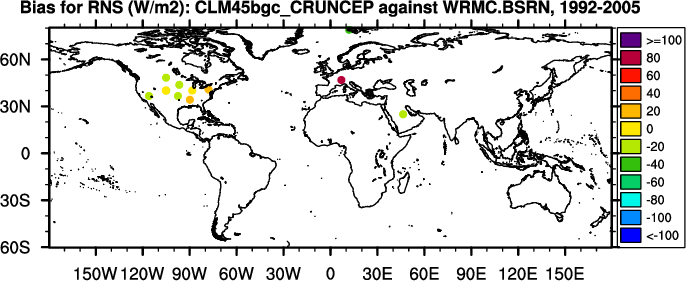
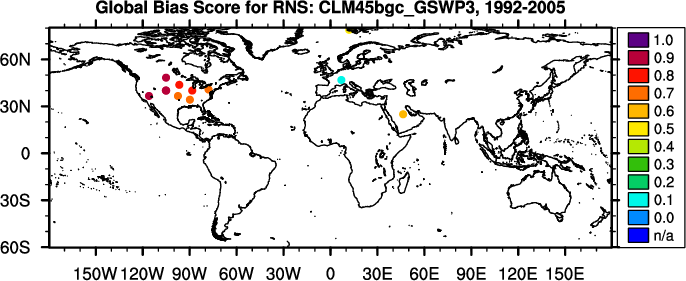
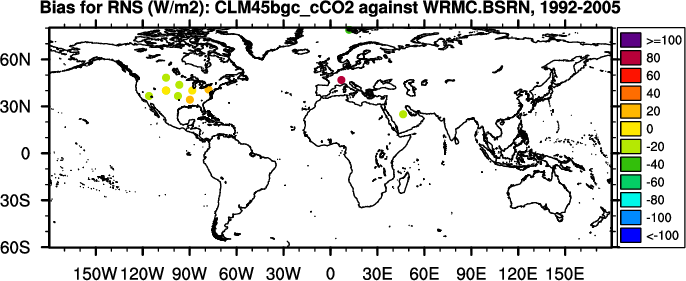
Bias (W/m2)
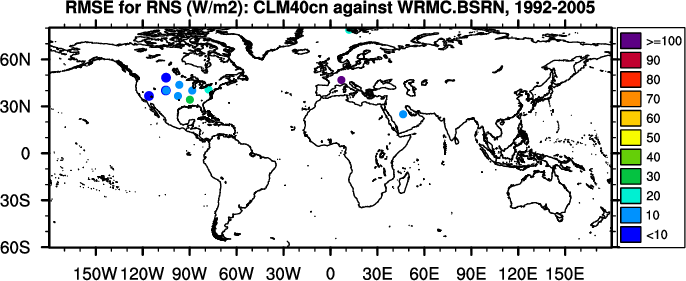
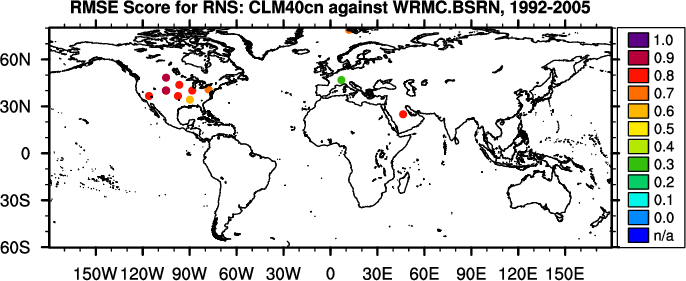
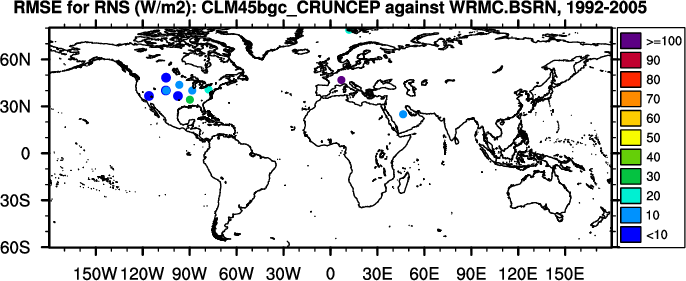
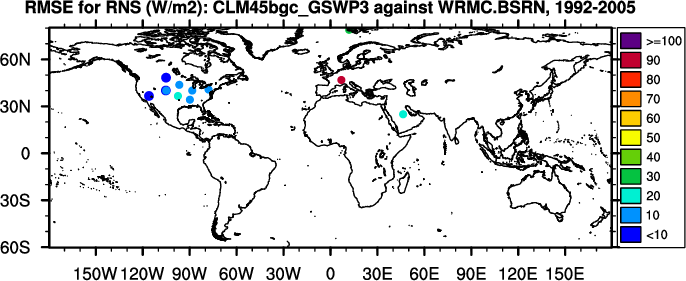
RMSE (W/m2)
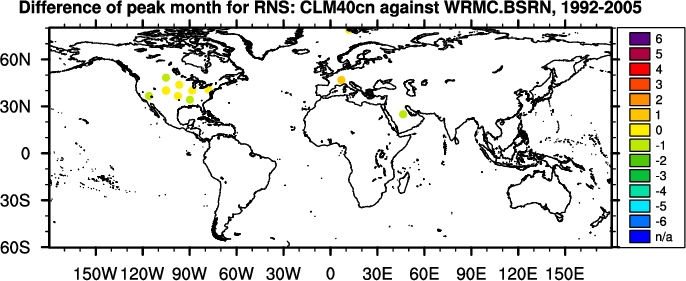
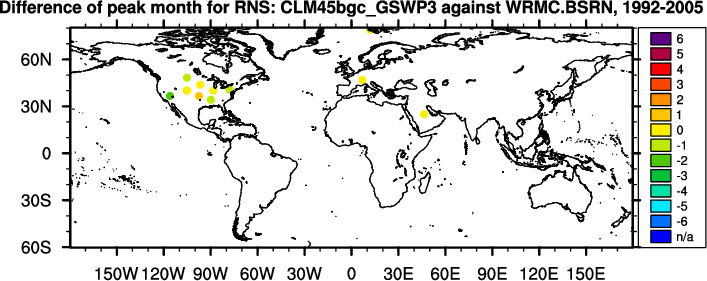
Phase Difference (months)
Regional
Mean
Individual Site
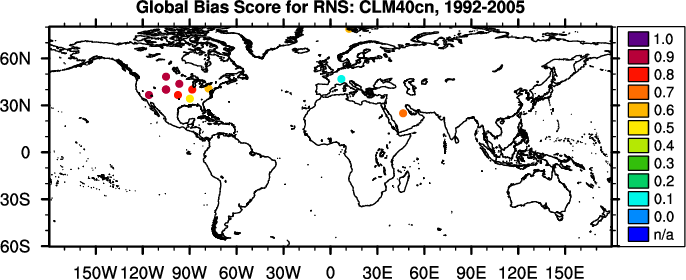
Global Bias
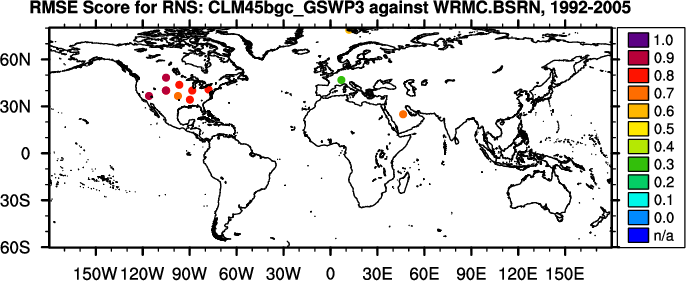
RMSE
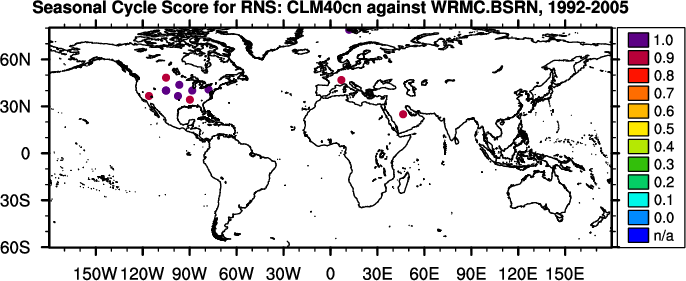
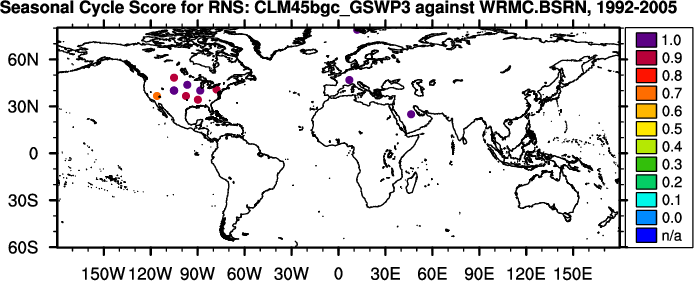
Seasonal Cycle
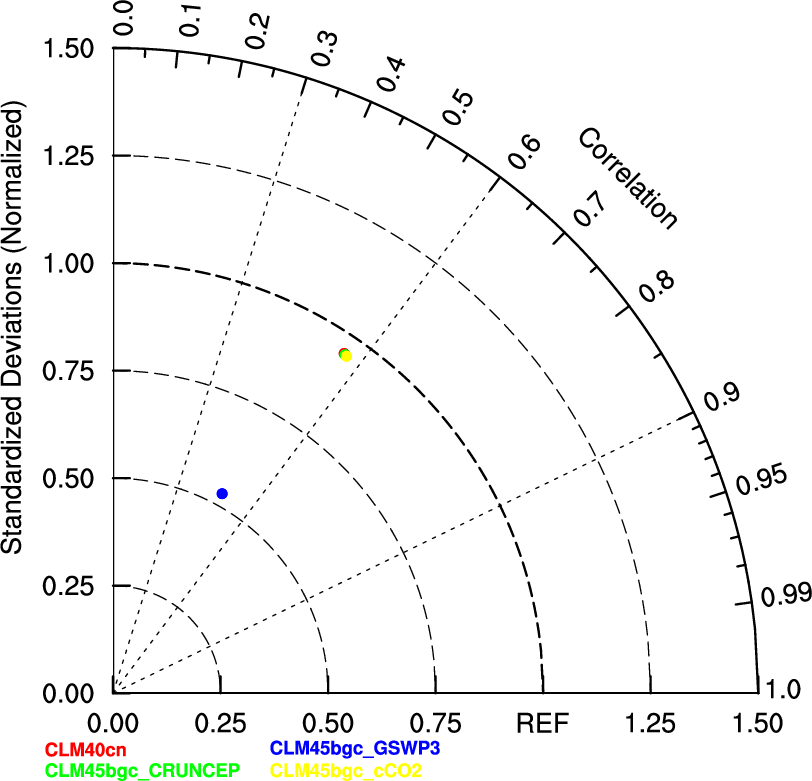
Spatial Distribution
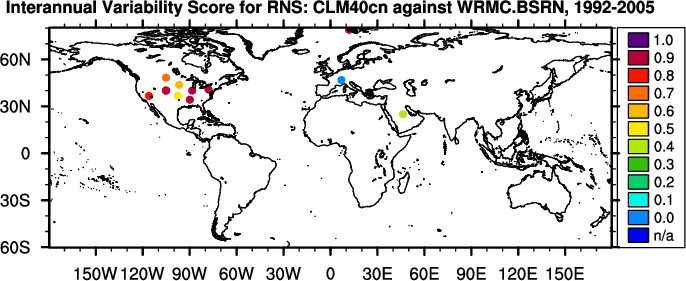
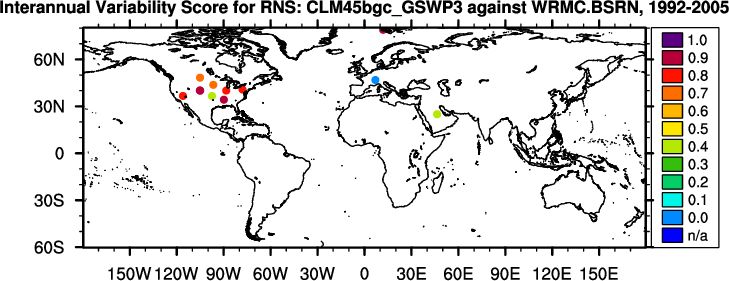
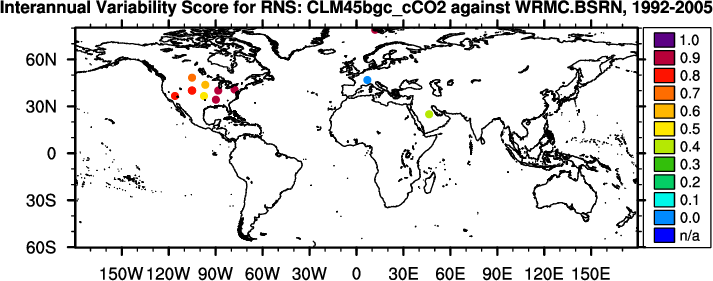
Interannual Variability
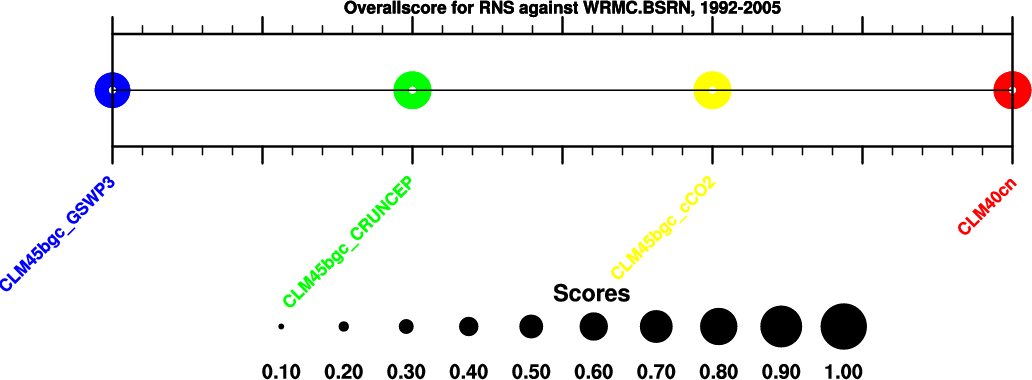
Overall
Benchmark
[Konig-Langl et al. (2013)]
57.9
-
-
0.0
access to
plots
access to
plots
-
-
-
-
-
-
CLM40cn
67.7
9.8
22.5
-0.2
access to
plots
access to
plots
0.78
0.80
0.97
0.78
0.74
0.81
CLM45bgc_CRUNCEP
66.7
8.8
23.0
-0.3
access to
plots
access to
plots
0.79
0.79
0.97
0.78
0.74
0.81
CLM45bgc_GSWP3
70.0
12.1
22.4
-0.3
access to
plots
access to
plots
0.77
0.79
0.96
0.51
0.74
0.76
CLM45bgc_cCO2
67.0
9.1
22.9
-0.3
access to
plots
access to
plots
0.79
0.79
0.97
0.78
0.74
0.81
Notes: In calculating overall score, rmse score contributes double in comparison with all other scores.