Output for ILAMB Diagnostics
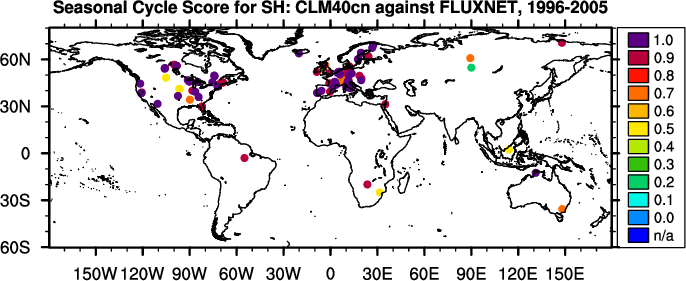
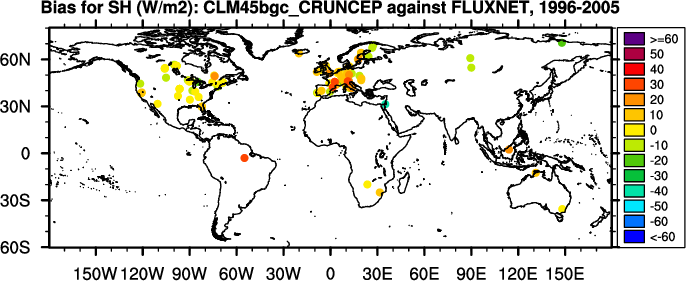
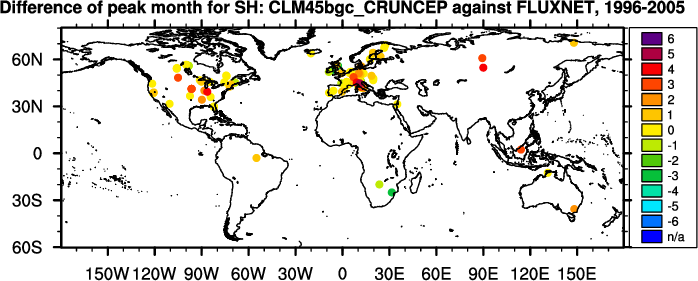
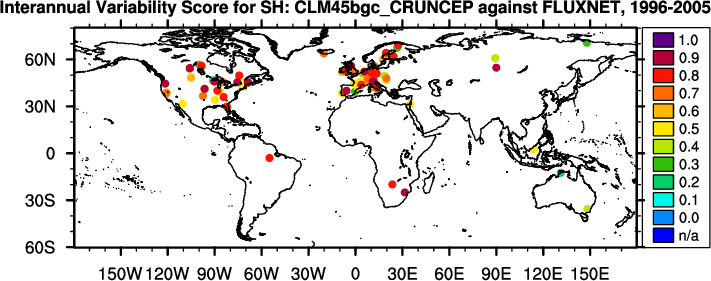
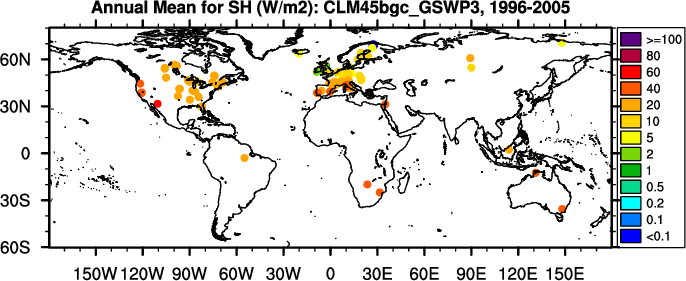
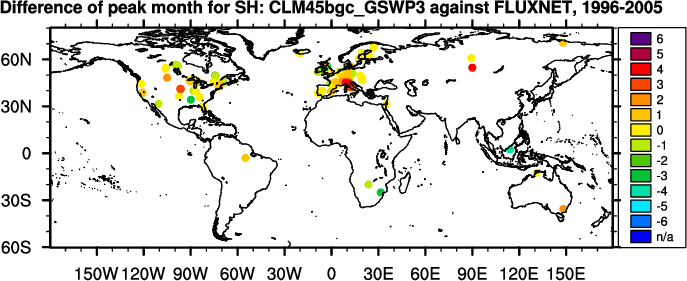
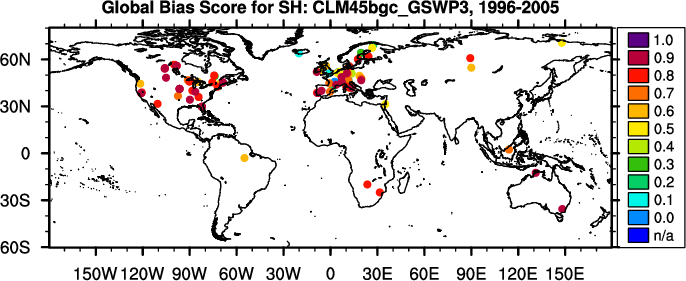
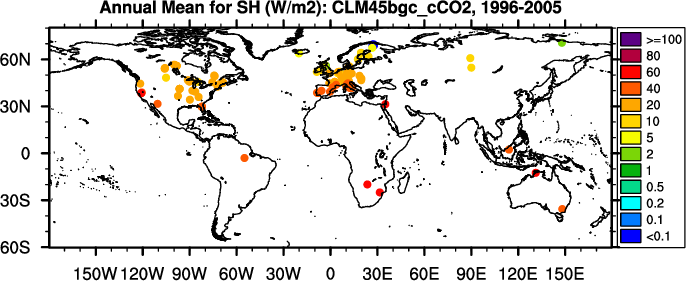
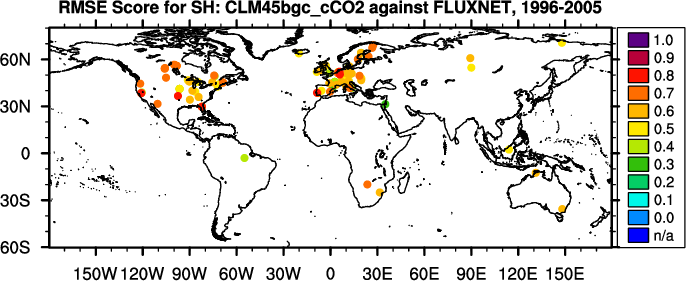
Diagnostic Summary for Sensible Heat: Model vs. FLUXNET
Global Patterns
Regional Patterns
Scoring
(
Info
)
Annual Mean (W/m2)
Bias (W/m2)
RMSE (W/m2)
Phase Difference (months)
Regional
Mean
Individual Site
Global Bias
RMSE
Seasonal Cycle
Spatial Distribution
Interannual Variability
Overall
Benchmark
[Lasslop et al. (2010)]
25.7
-
-
0.0
access to
plots
access to
plots
-
-
-
-
-
-
CLM40cn
34.4
8.8
18.5
0.4
access to
plots
access to
plots
0.74
0.62
0.89
0.83
0.65
0.72
CLM45bgc_CRUNCEP
32.3
6.6
18.3
0.4
access to
plots
access to
plots
0.76
0.62
0.88
0.86
0.63
0.73
CLM45bgc_GSWP3
26.4
0.7
15.0
0.0
access to
plots
access to
plots
0.79
0.68
0.89
0.86
0.65
0.76
CLM45bgc_cCO2
32.5
6.8
18.5
0.5
access to
plots
access to
plots
0.75
0.62
0.85
0.86
0.63
0.72
Notes: In calculating overall score, rmse score contributes double in comparison with all other scores.