Output for ILAMB Diagnostics
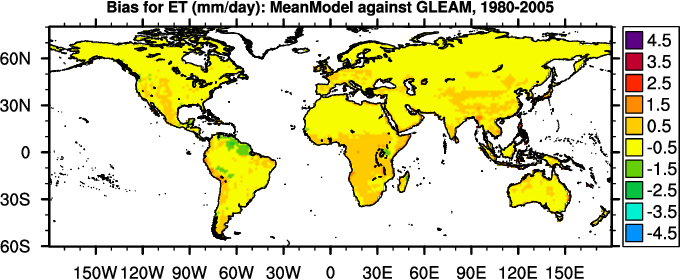
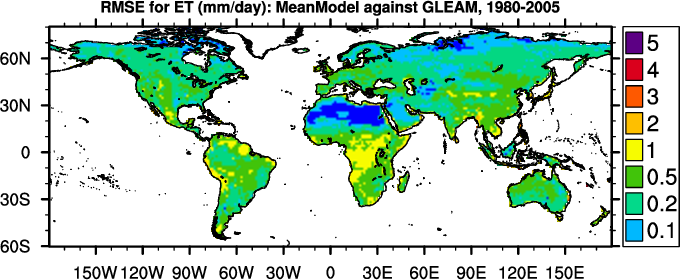
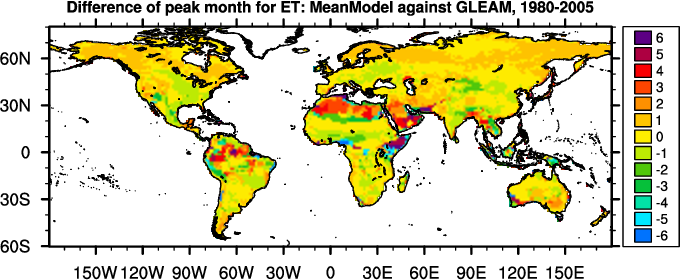
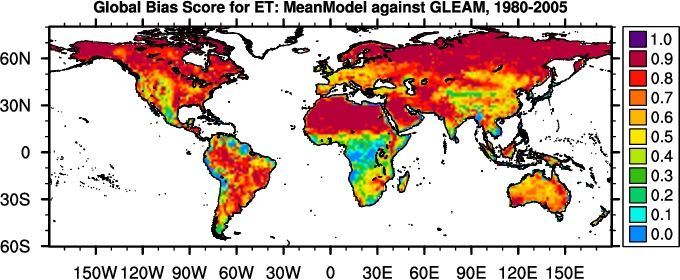
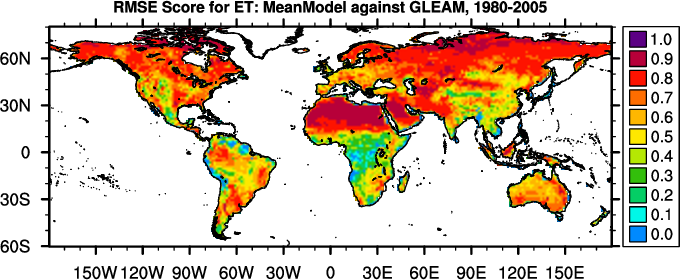
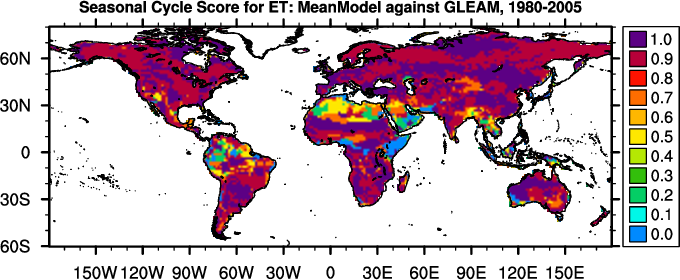
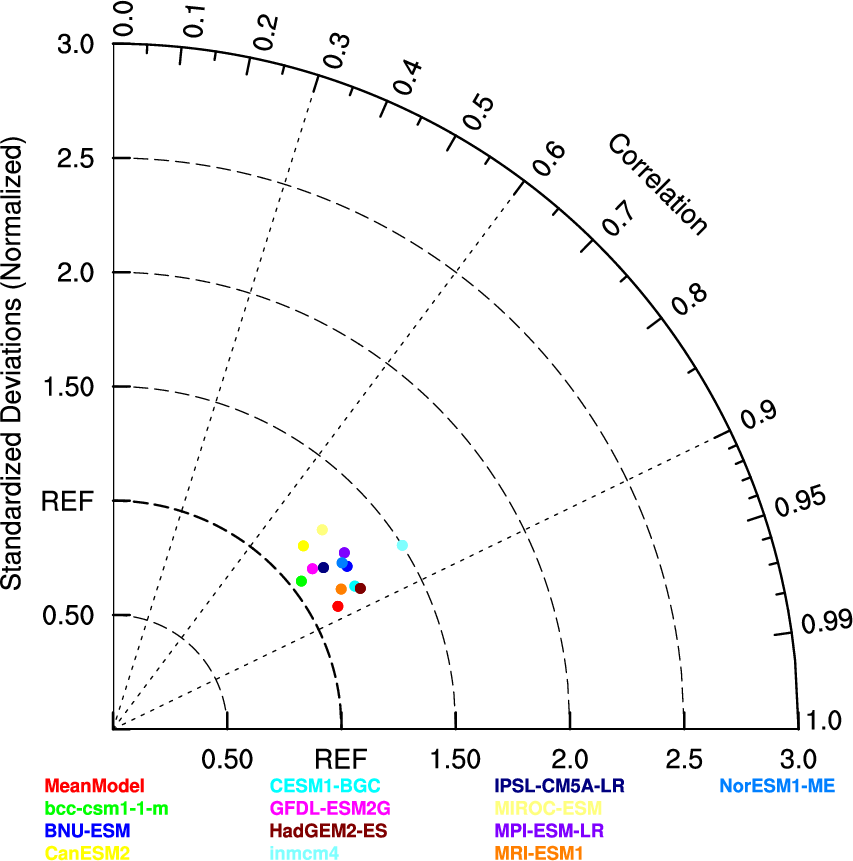
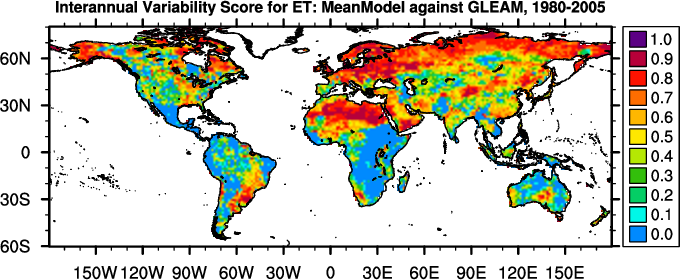
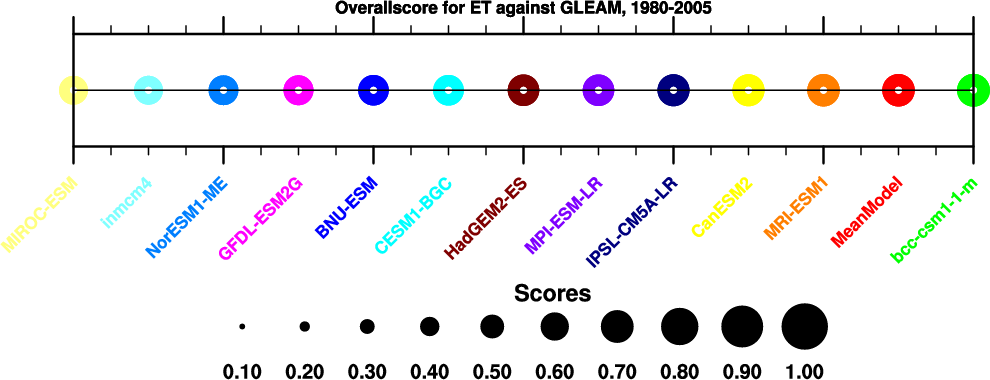
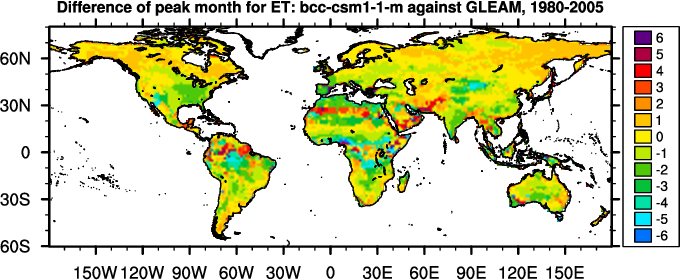
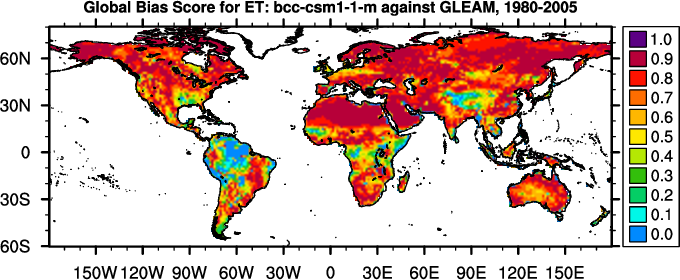
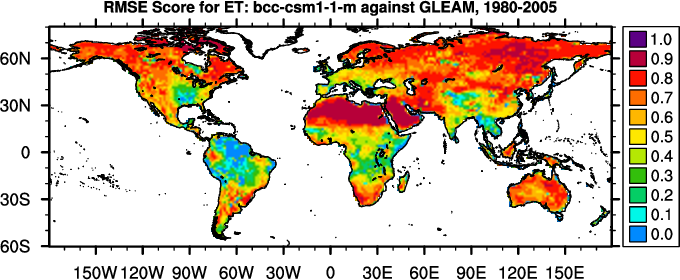
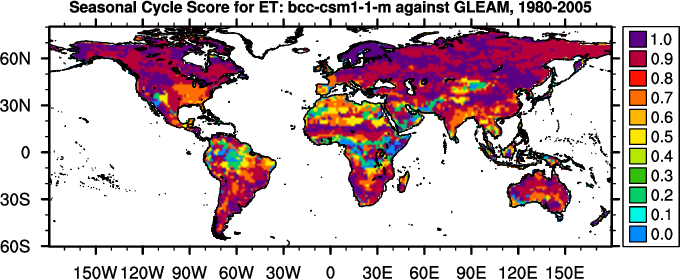
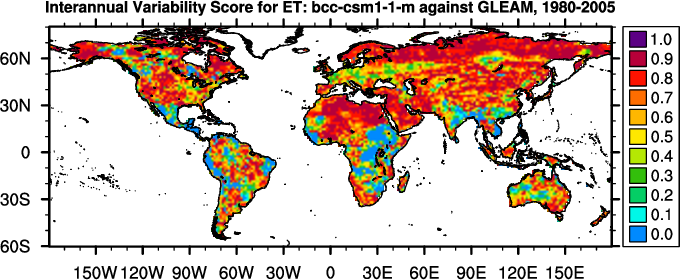
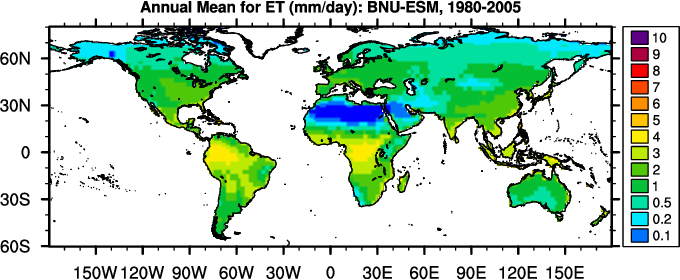
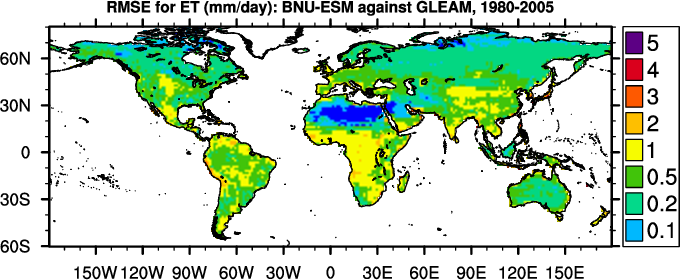
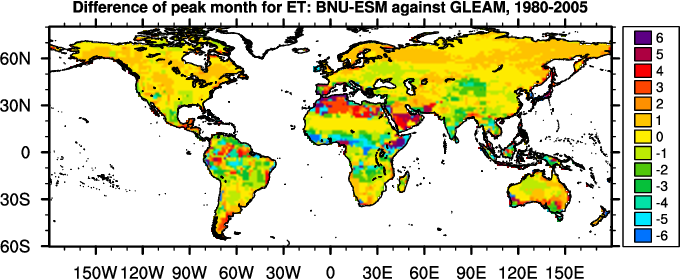
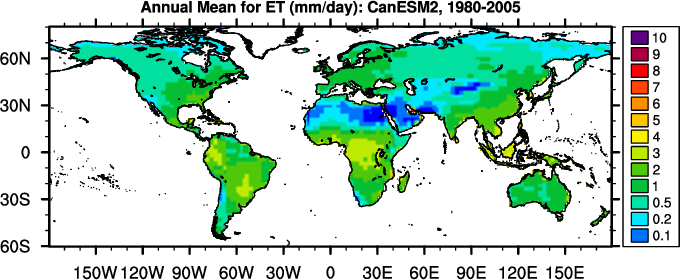
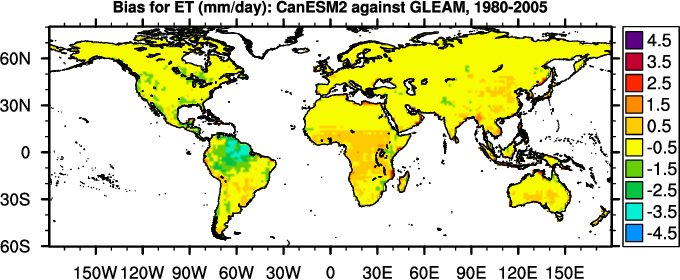
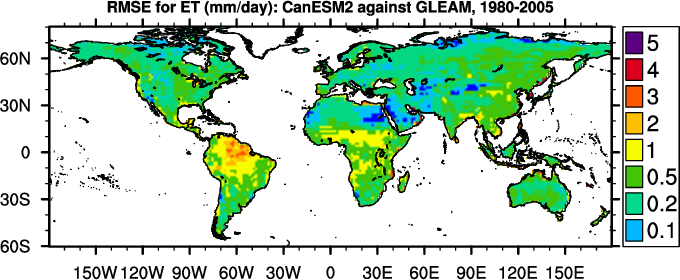
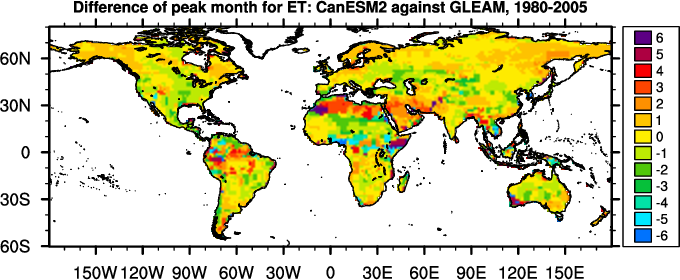
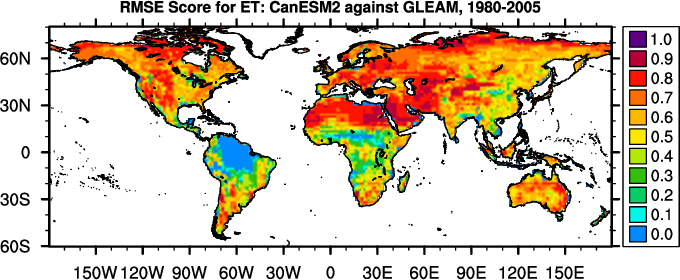
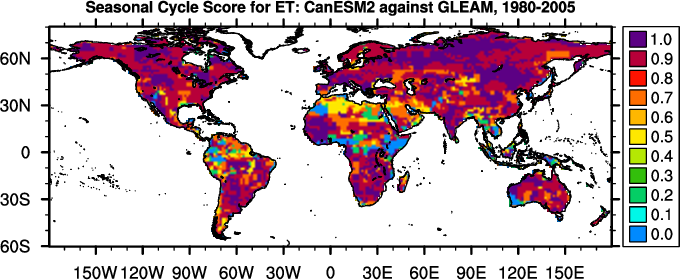
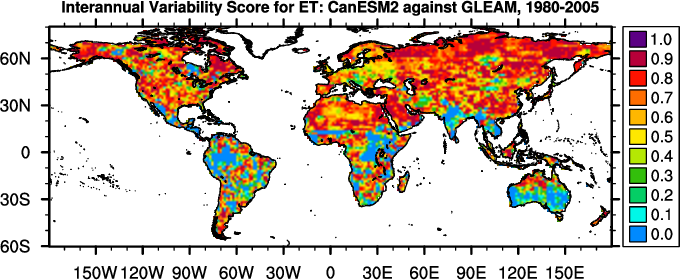
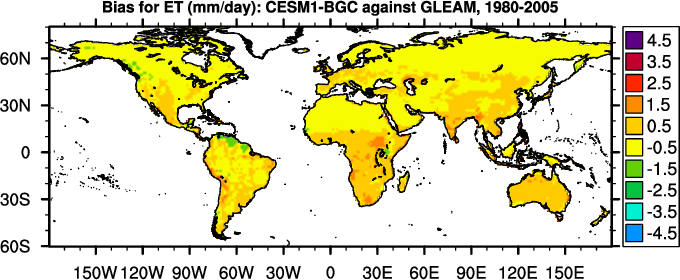
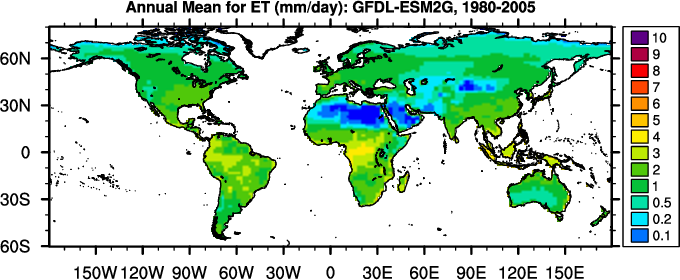
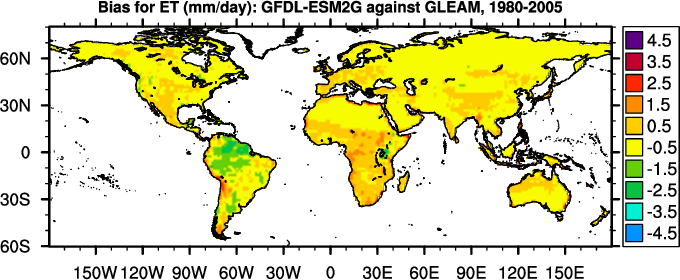
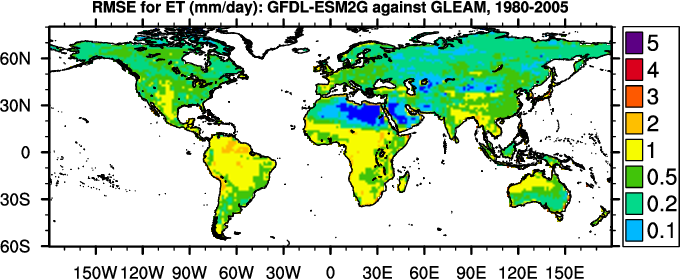
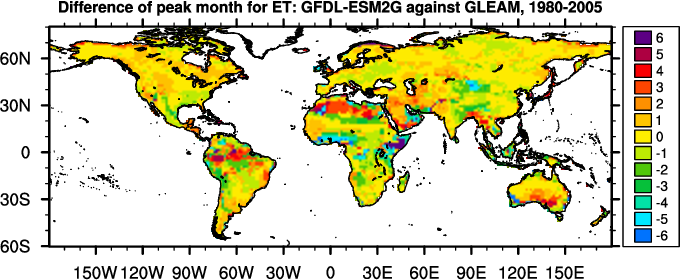
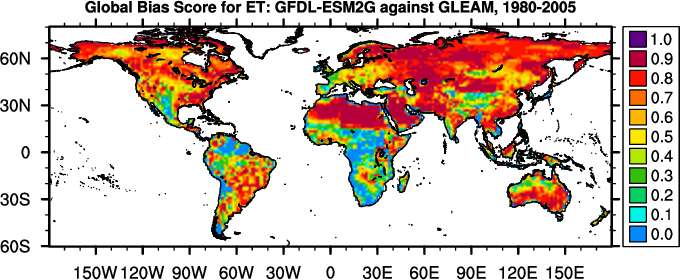
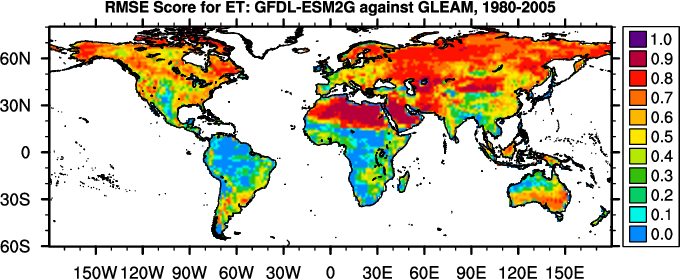
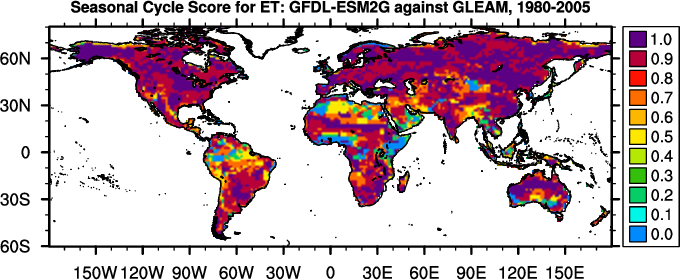
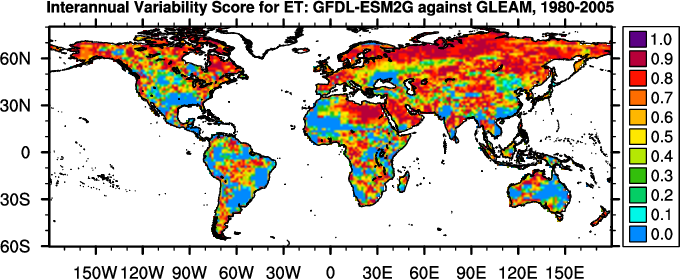
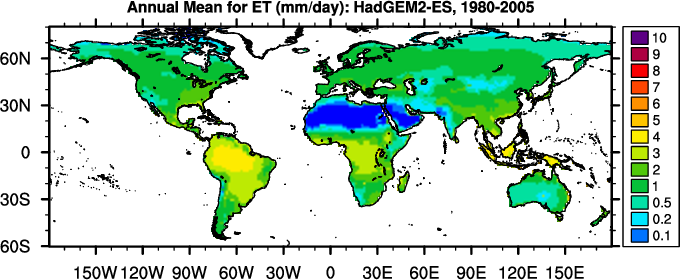
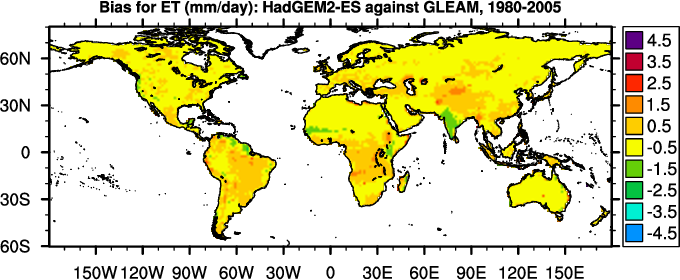
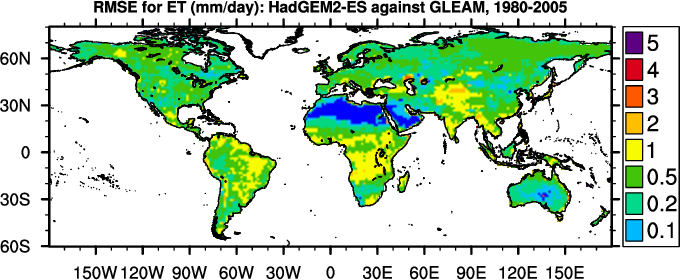
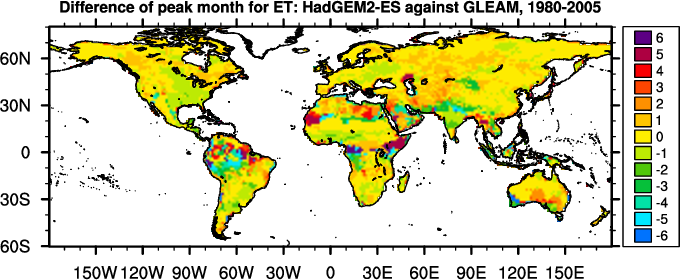
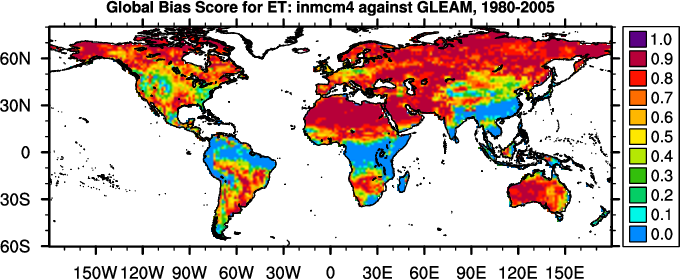
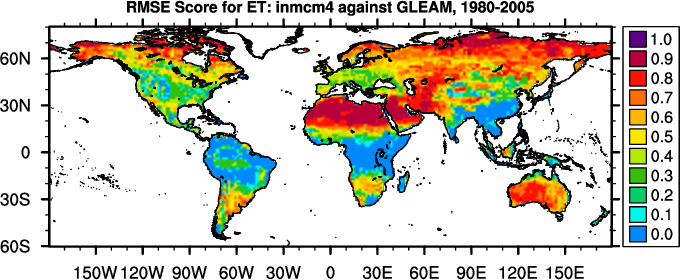
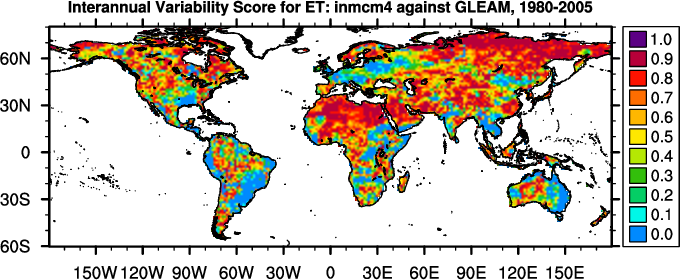
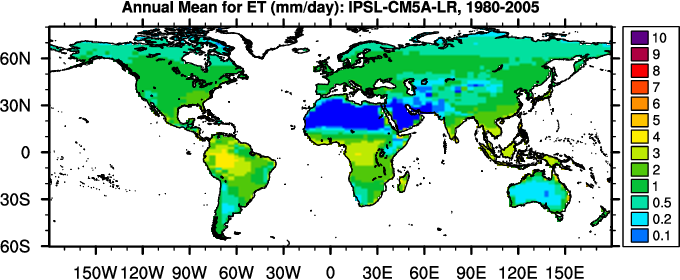
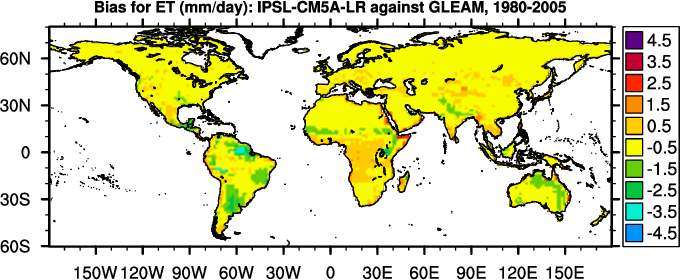
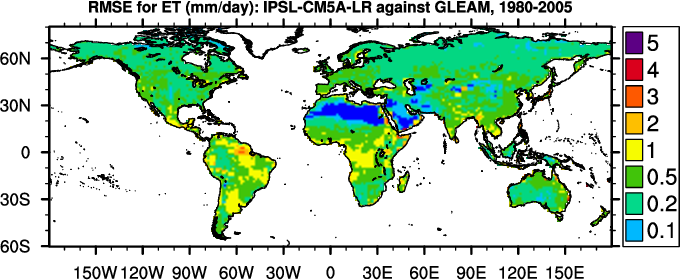
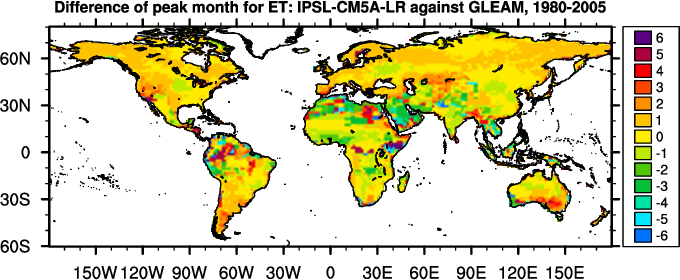
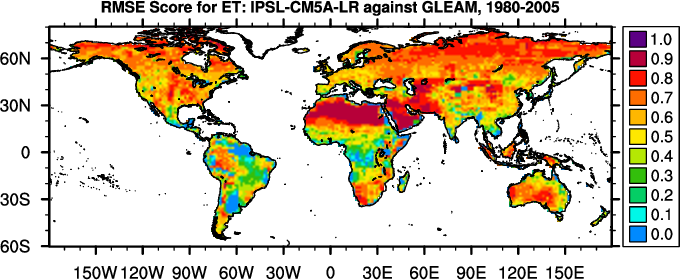
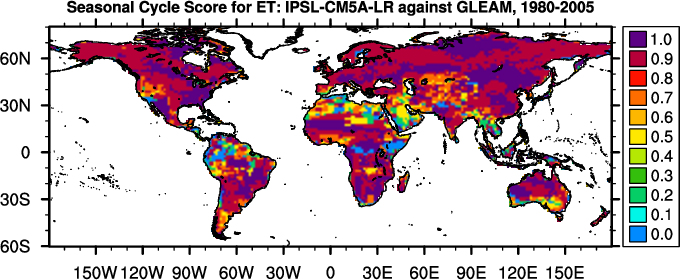
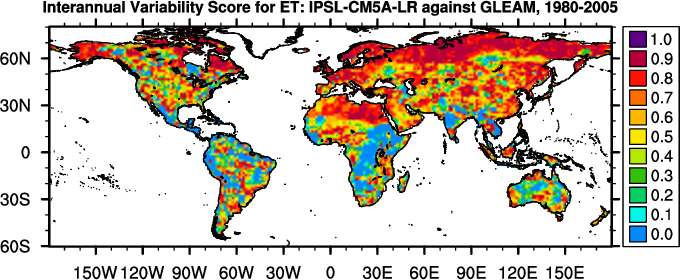
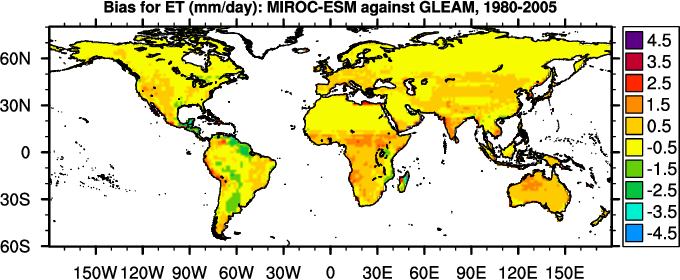
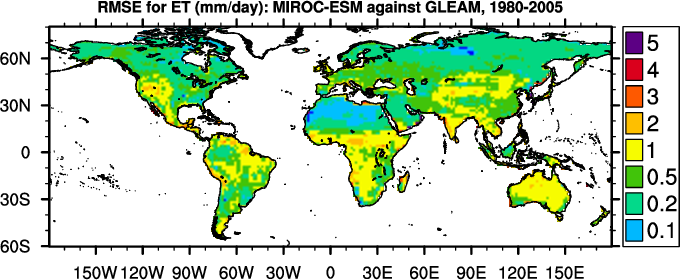
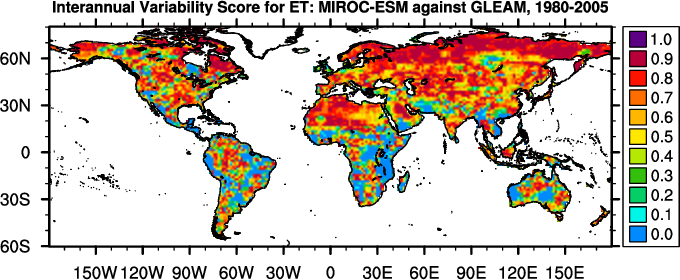
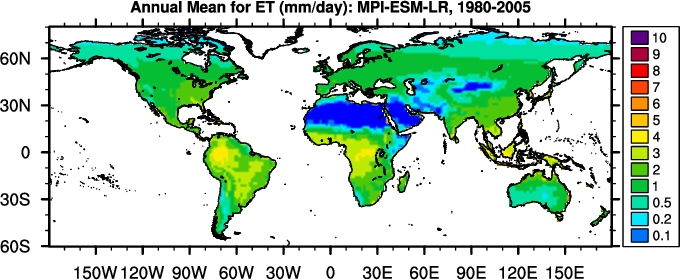
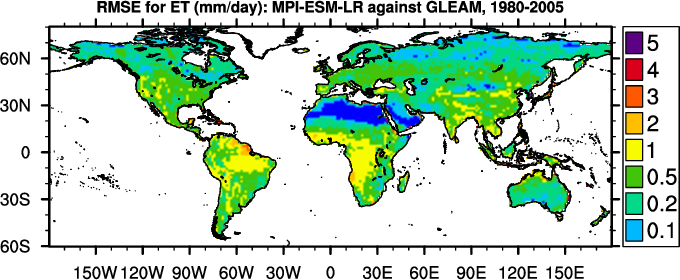
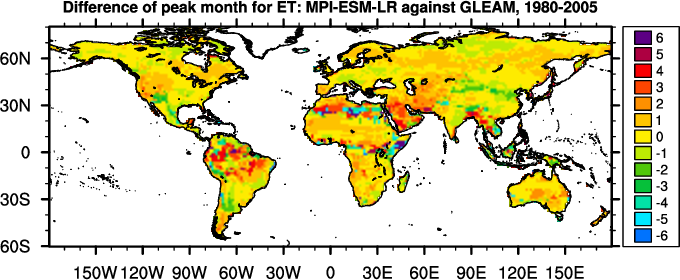
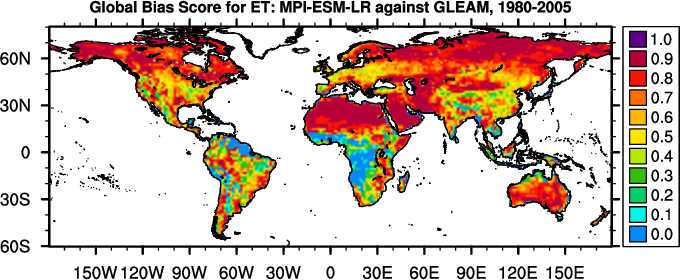
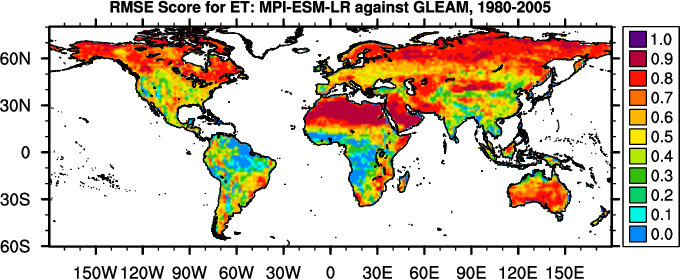
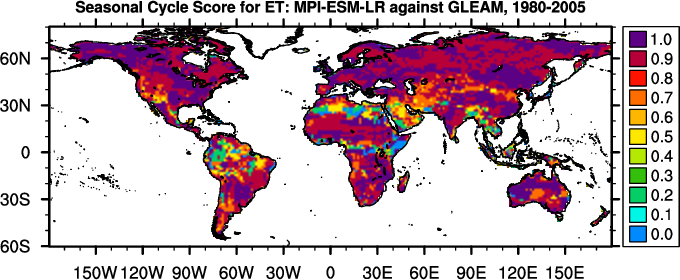
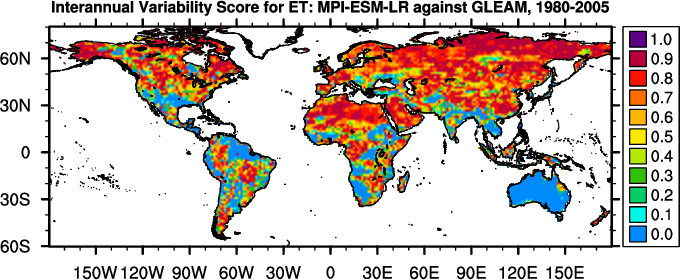
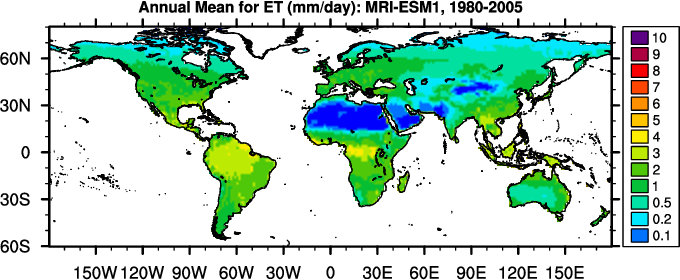
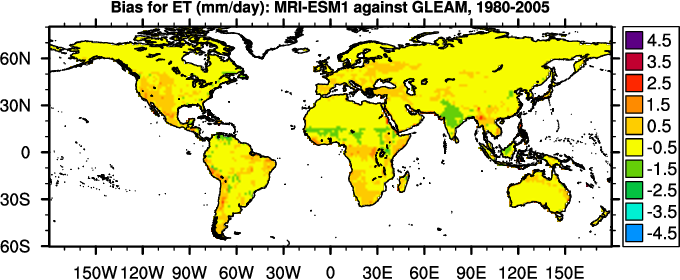
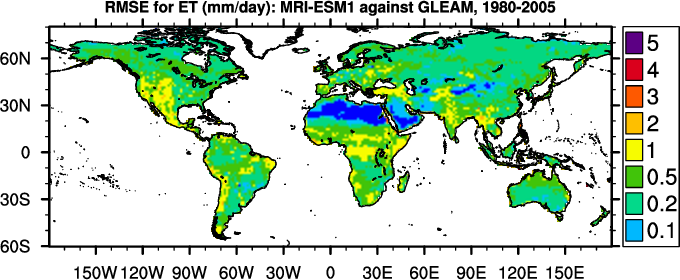
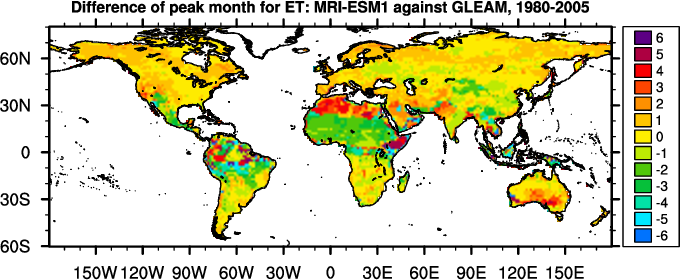
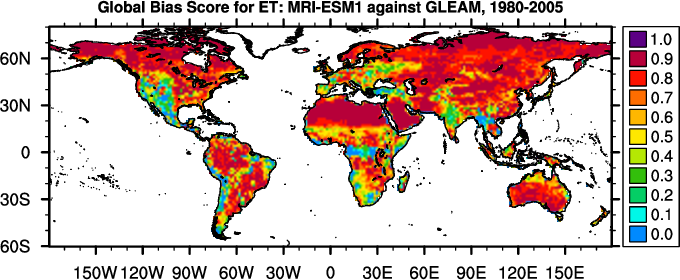
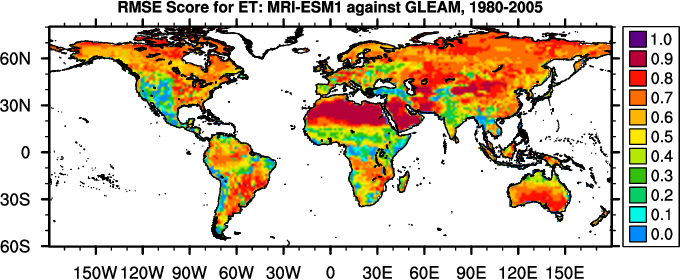
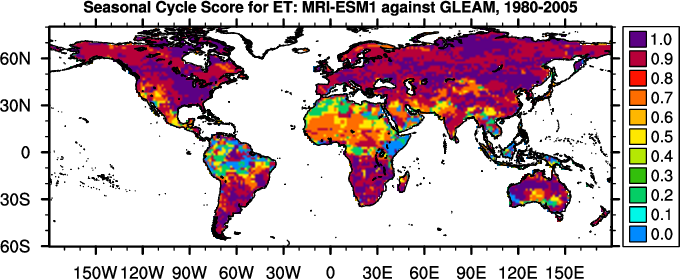
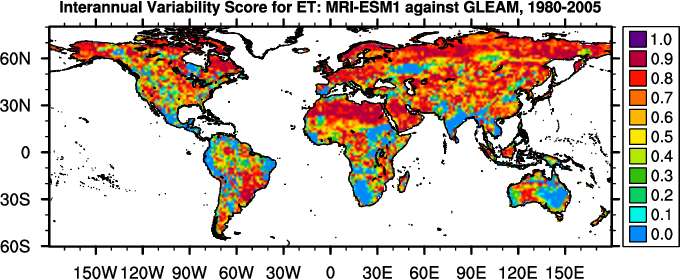
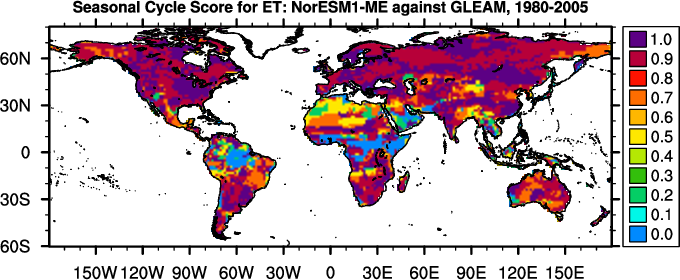
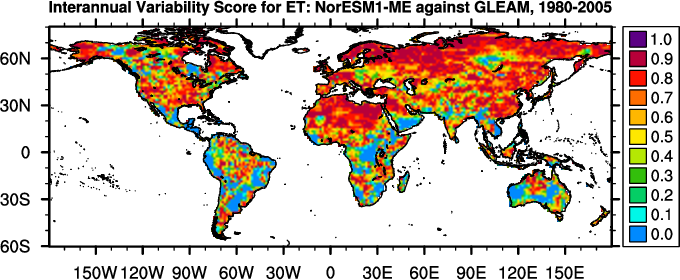
Diagnostic Summary for Evapotranspiration: Model vs. GLEAM
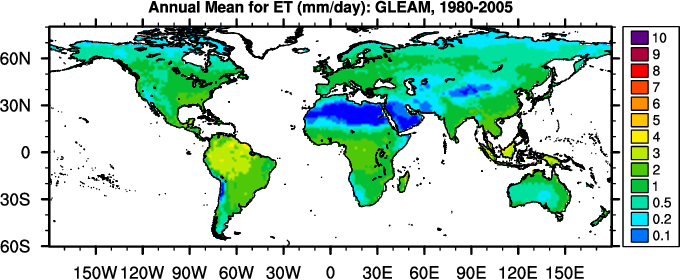
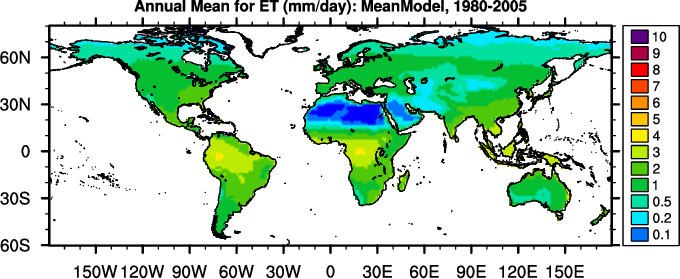
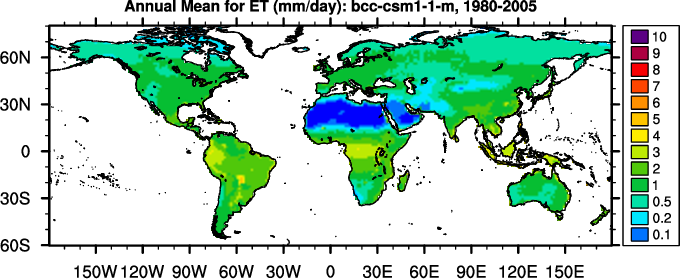
Global Patterns
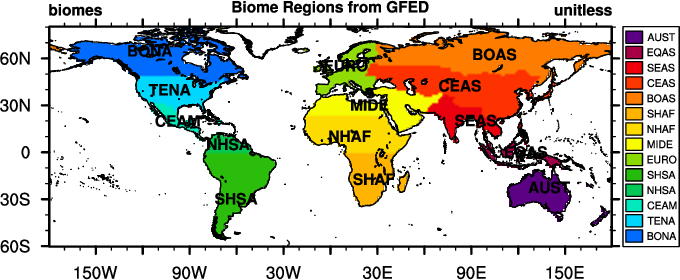
Regional Patterns
Scoring
(
Info
)
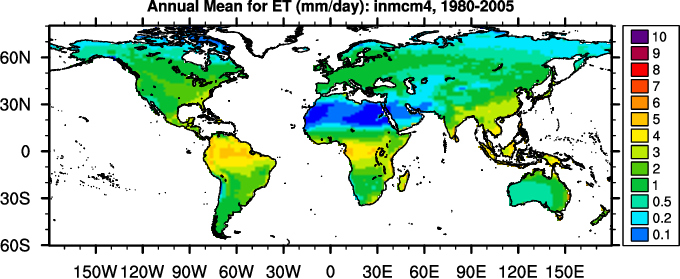
Annual Mean (mm/day)
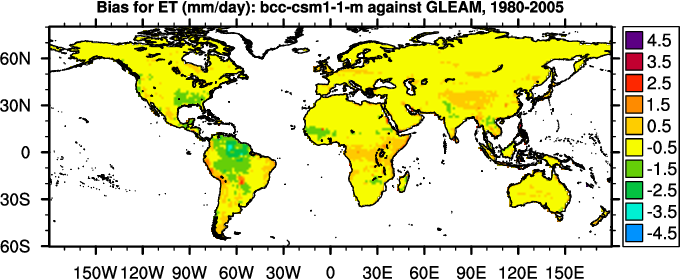
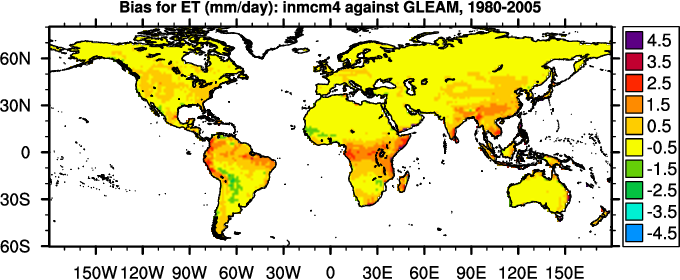
Bias (mm/day)
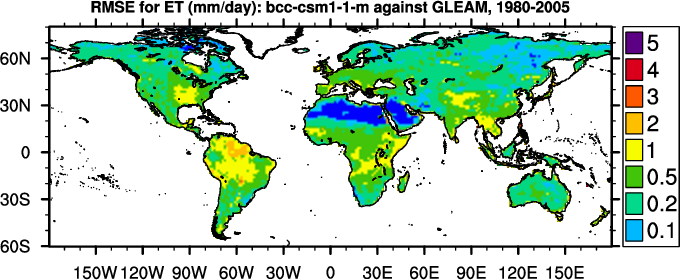
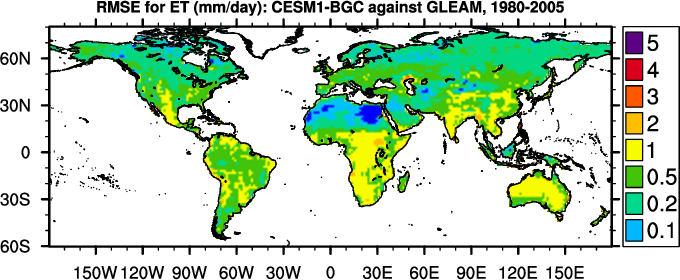
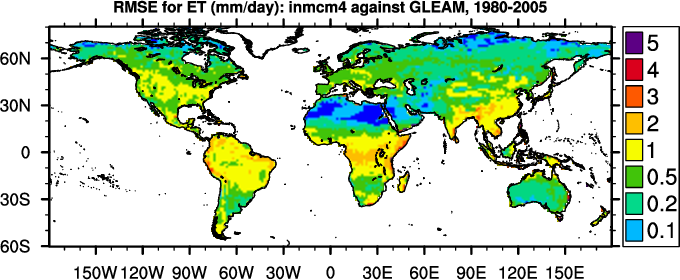
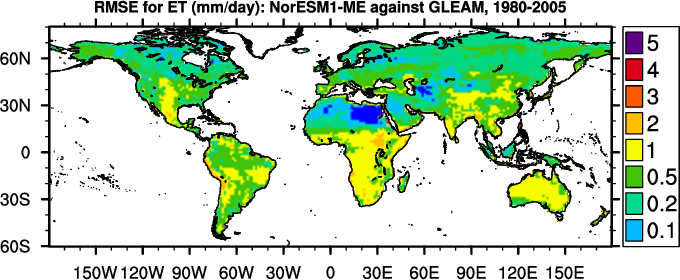
RMSE (mm/day)
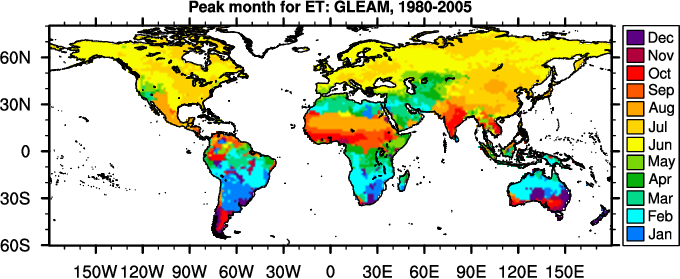
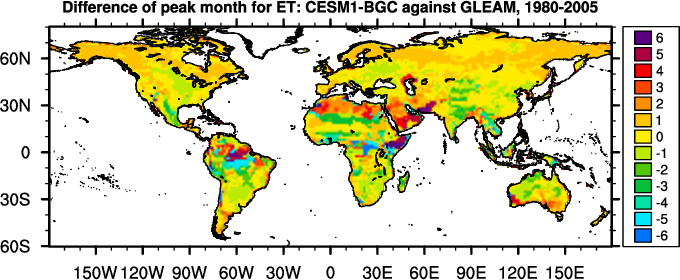
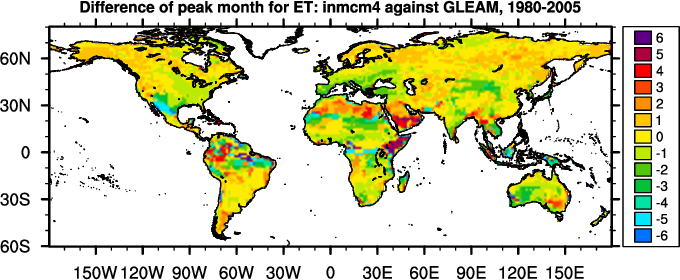
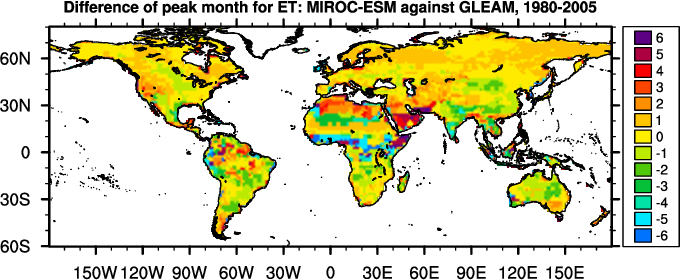
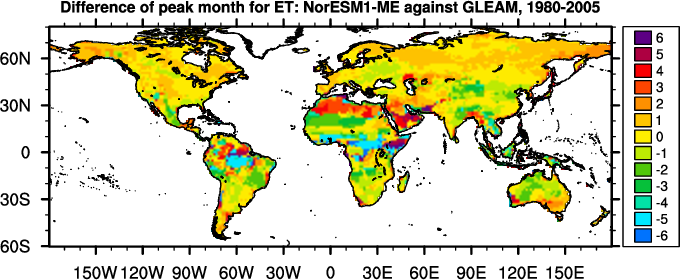
Phase Change (months)
Regional
Mean
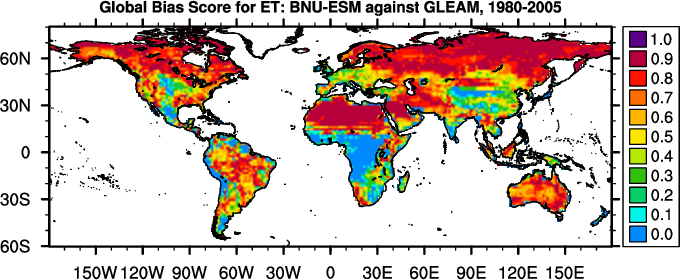
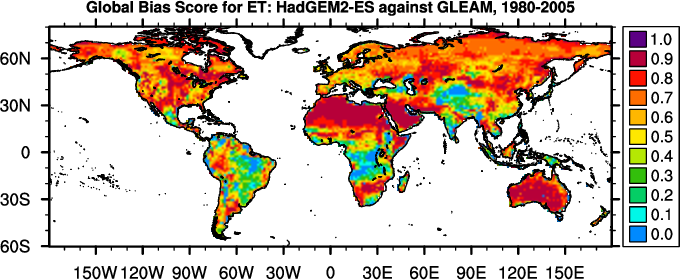
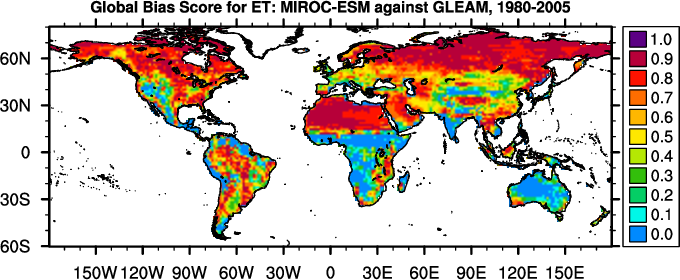
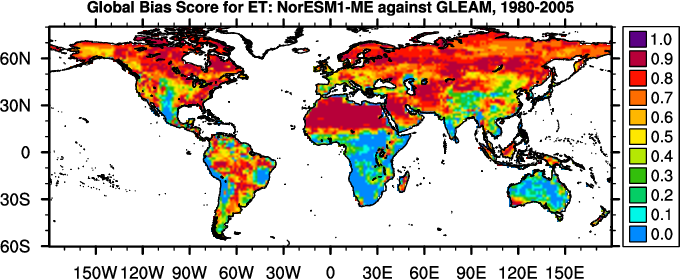
Global Bias
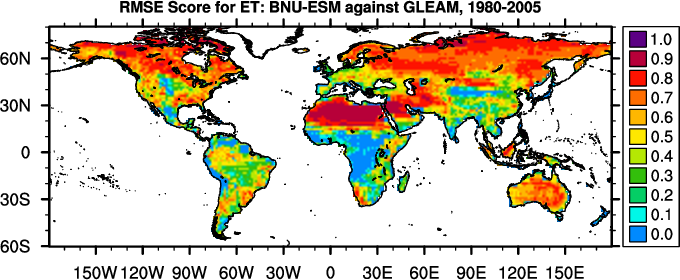
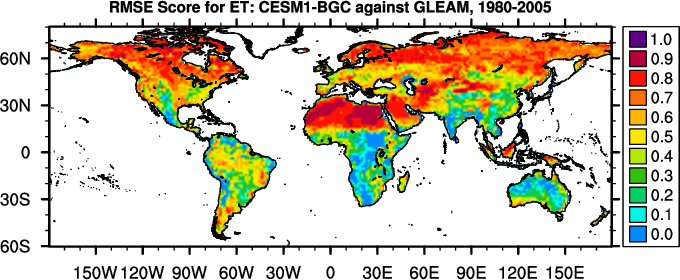
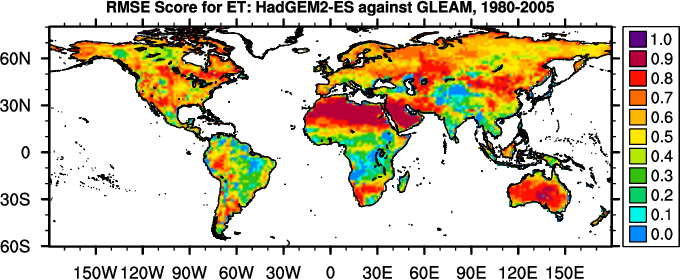
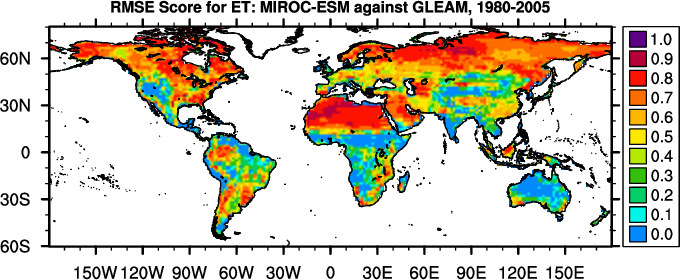
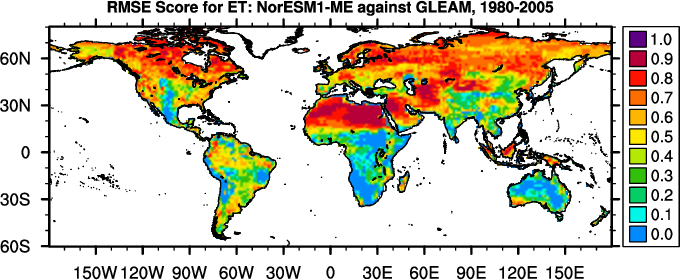
RMSE
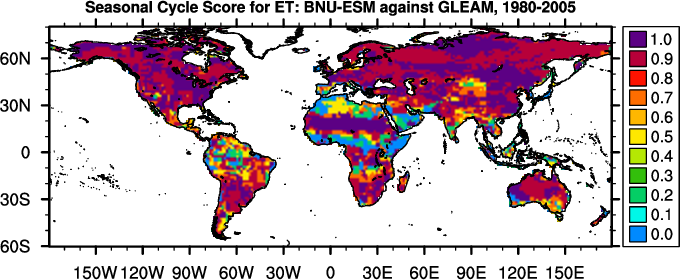
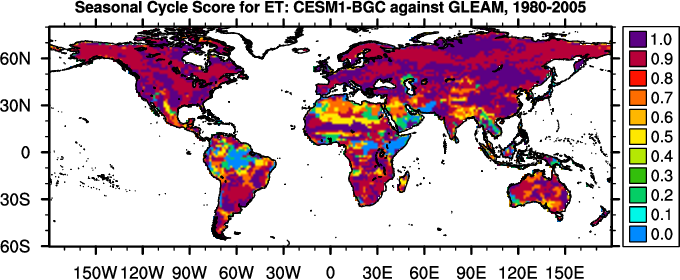
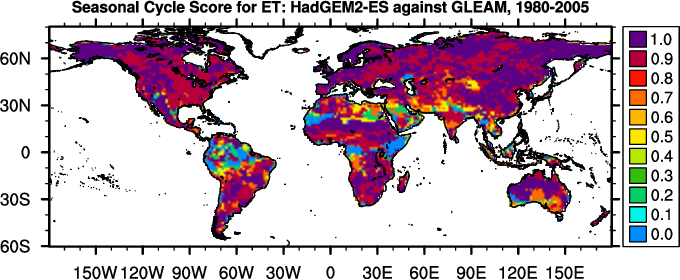
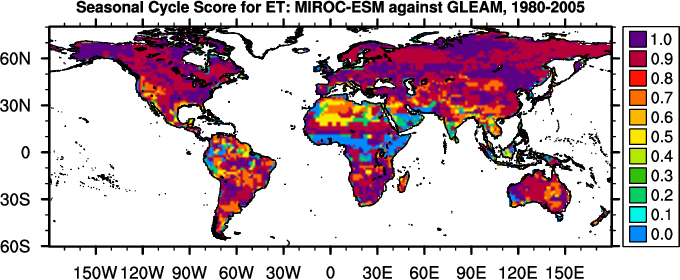
Seasonal Cycle
Spatial Distribution
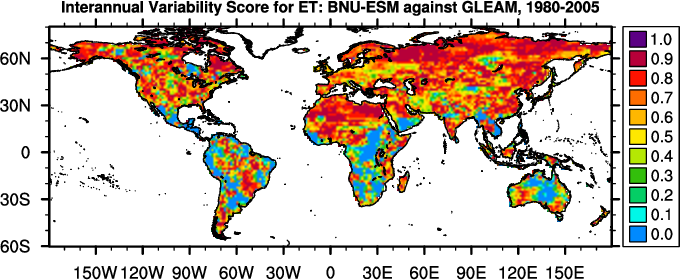
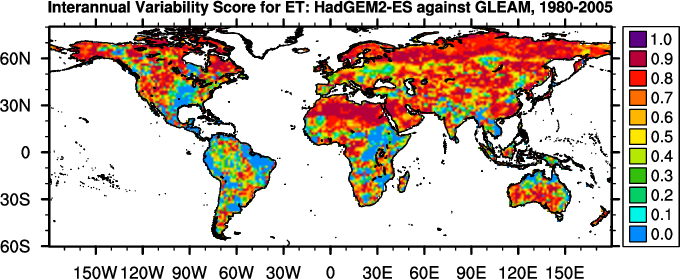
Interannual Variability
Overall
Benchmark
[Miralles et al. (2011)]
1.32
-
-
0.00
access to
plots
-
-
-
-
-
-
MeanModel
1.68
0.36
0.59
0.29
access to
plots
0.69
0.63
0.83
0.93
0.45
0.69
bcc-csm1-1-m
1.48
0.16
0.67
-0.26
access to
plots
0.71
0.59
0.79
0.89
0.64
0.70
BNU-ESM
1.78
0.46
0.80
0.05
access to
plots
0.61
0.52
0.78
0.87
0.60
0.65
CanESM2
1.45
0.13
0.73
0.06
access to
plots
0.70
0.58
0.81
0.84
0.59
0.68
CESM1-BGC
1.83
0.52
0.80
0.12
access to
plots
0.58
0.51
0.80
0.89
0.62
0.65
GFDL-ESM2G
1.72
0.40
0.84
0.07
access to
plots
0.62
0.49
0.80
0.88
0.54
0.64
HadGEM2-ES
1.73
0.41
0.73
0.10
access to
plots
0.64
0.55
0.82
0.89
0.59
0.67
inmcm4
1.83
0.51
0.95
-0.11
access to
plots
0.61
0.46
0.81
0.79
0.55
0.61
IPSL-CM5A-LR
1.49
0.17
0.68
0.25
access to
plots
0.68
0.58
0.81
0.88
0.57
0.68
MIROC-ESM
1.87
0.55
0.94
0.15
access to
plots
0.56
0.47
0.78
0.82
0.57
0.61
MPI-ESM-LR
1.66
0.34
0.74
0.40
access to
plots
0.66
0.57
0.83
0.85
0.56
0.67
MRI-ESM1
1.55
0.24
0.66
0.08
access to
plots
0.70
0.59
0.78
0.90
0.59
0.69
NorESM1-ME
1.79
0.47
0.84
0.07
access to
plots
0.58
0.49
0.78
0.86
0.60
0.63
Notes: In calculating overall score, rmse score contributes double in comparison with all other scores.