Output for ILAMB Diagnostics
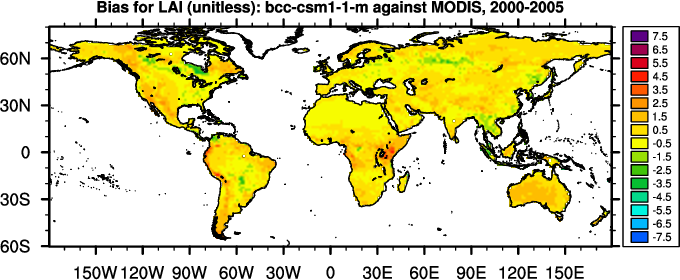
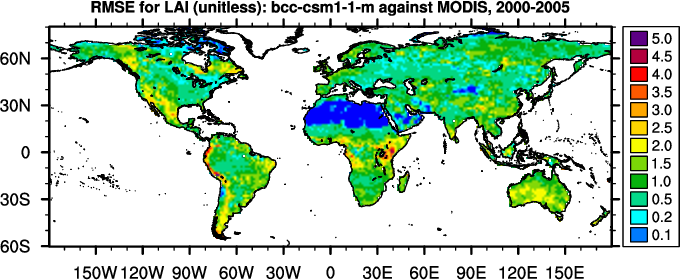
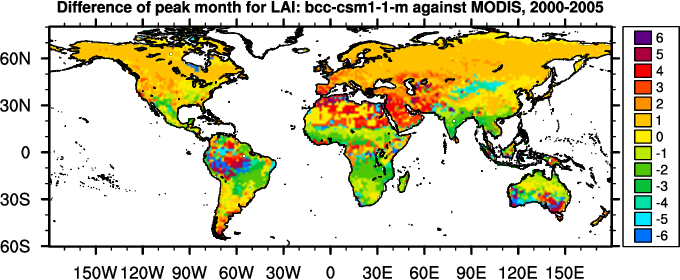
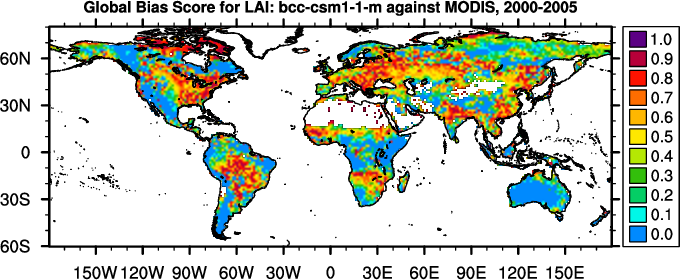
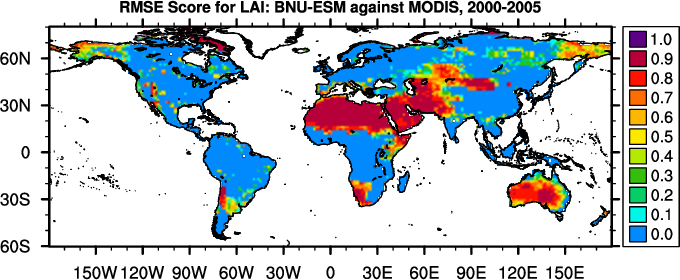
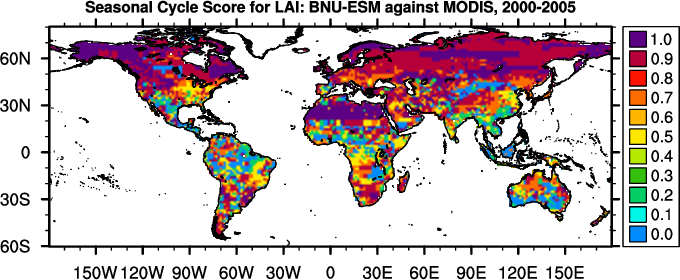
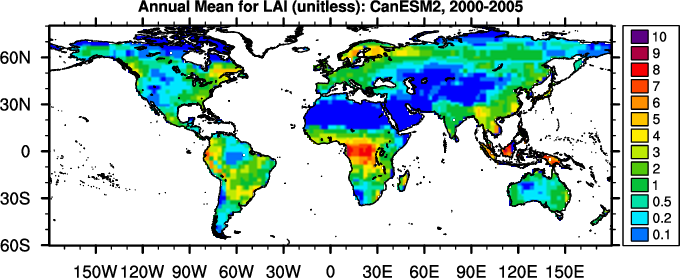
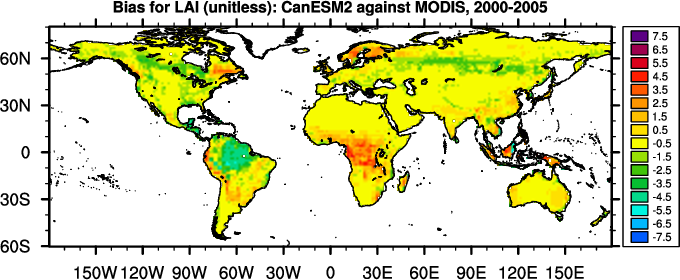
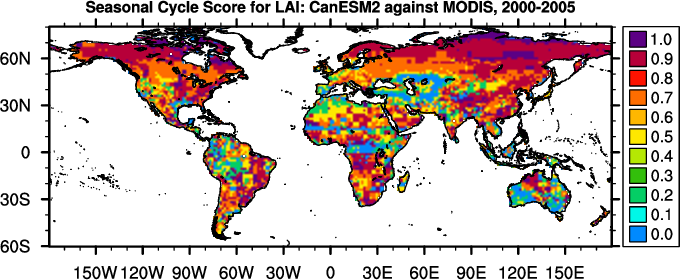
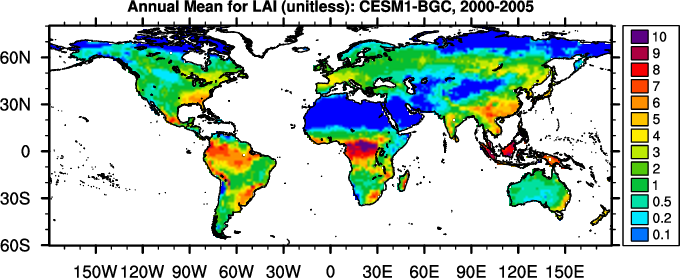
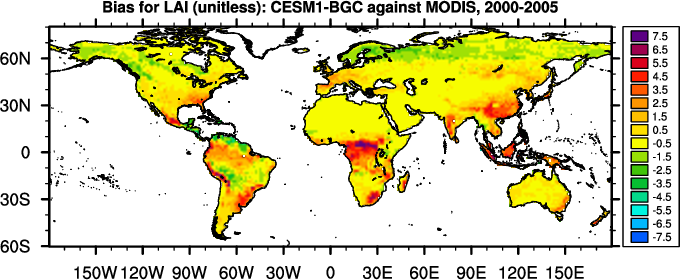
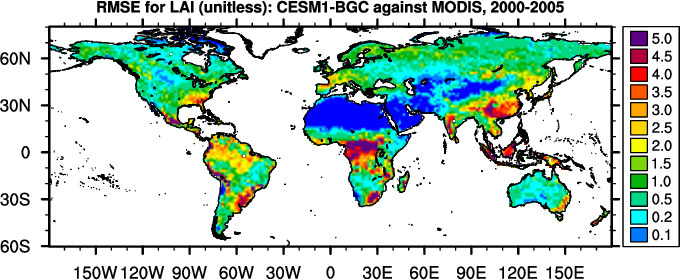
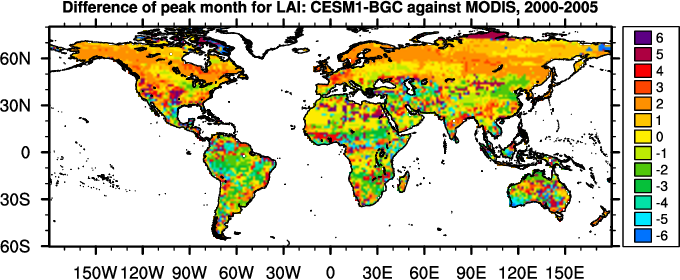
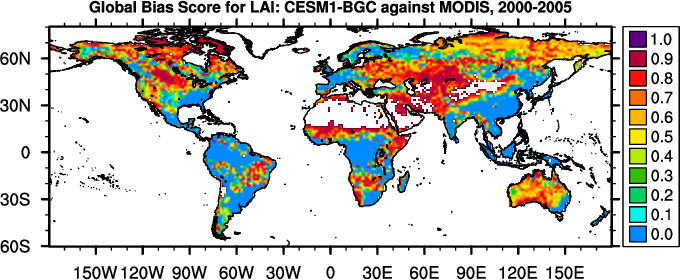
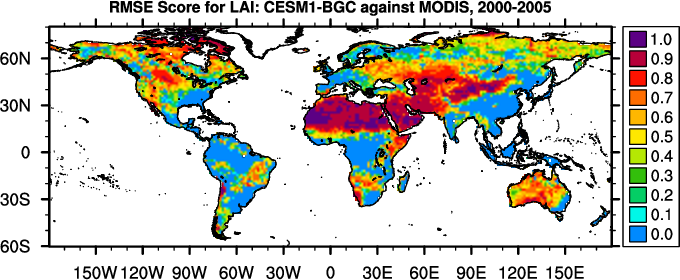
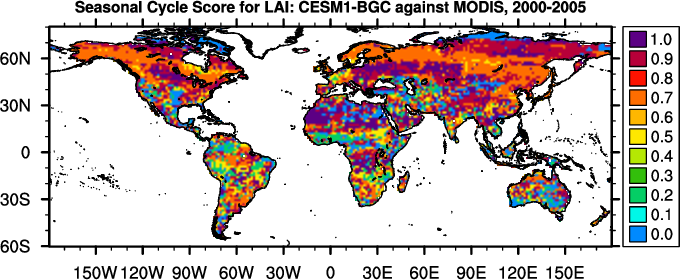
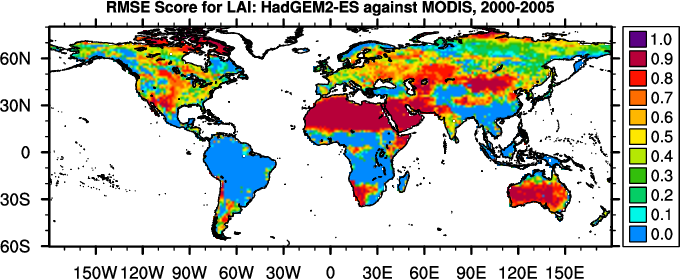
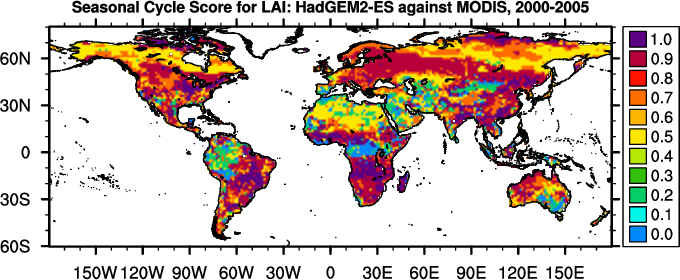
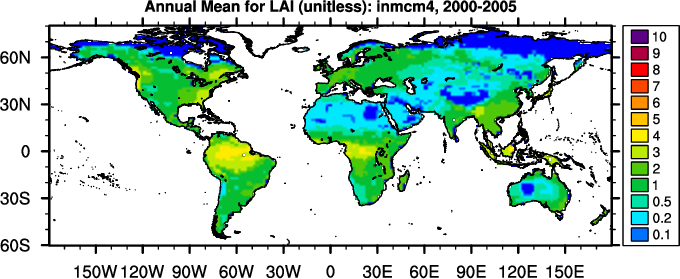
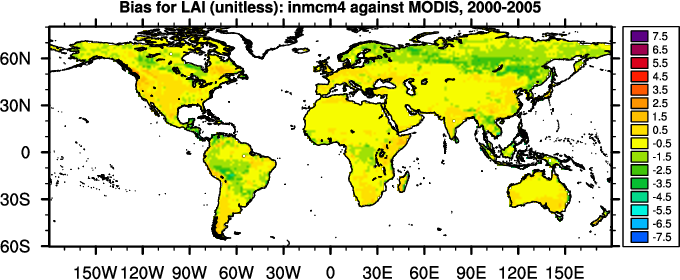
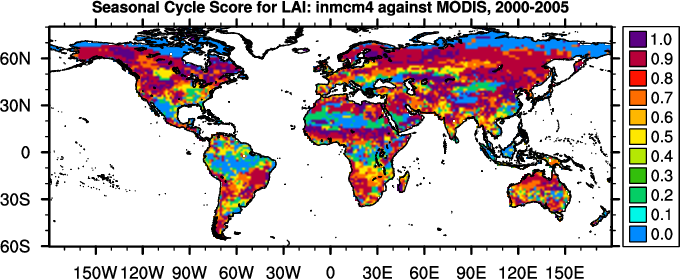
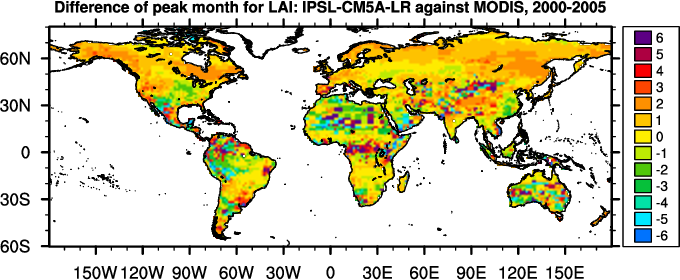
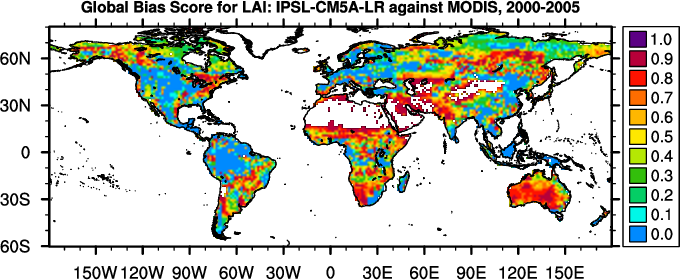
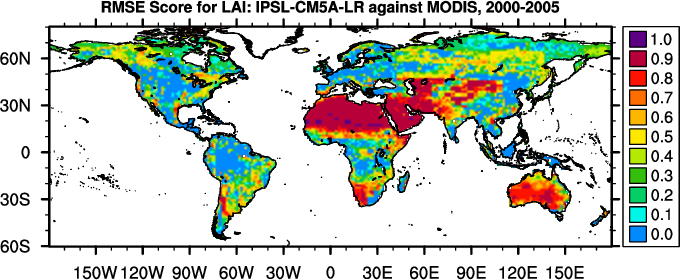
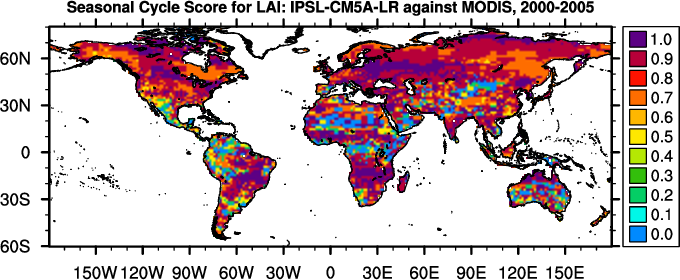
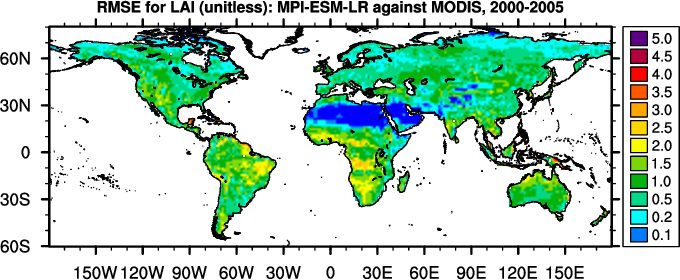
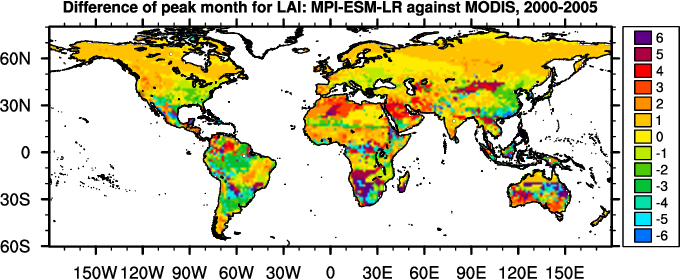
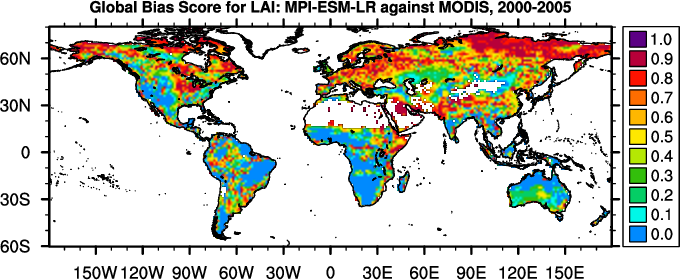
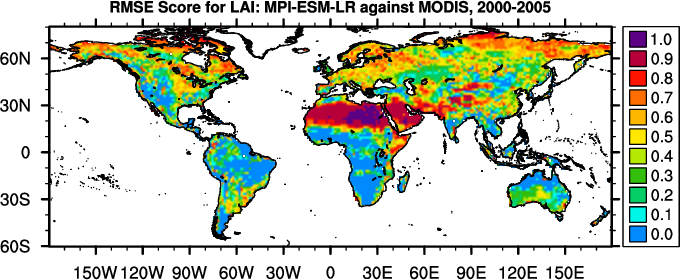
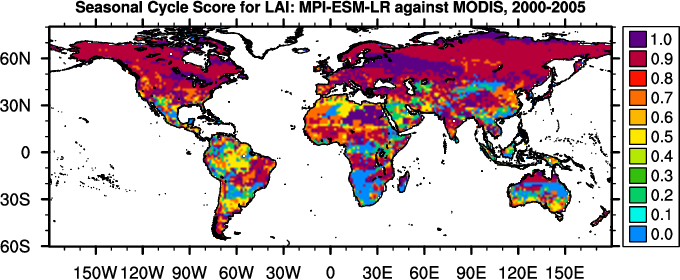
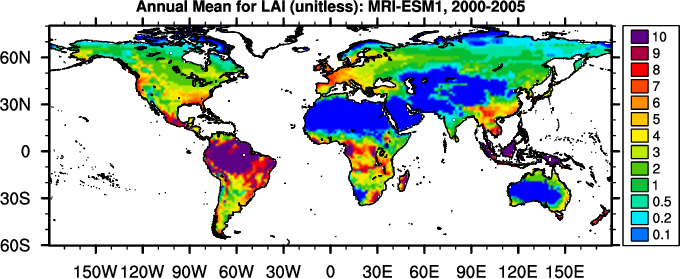
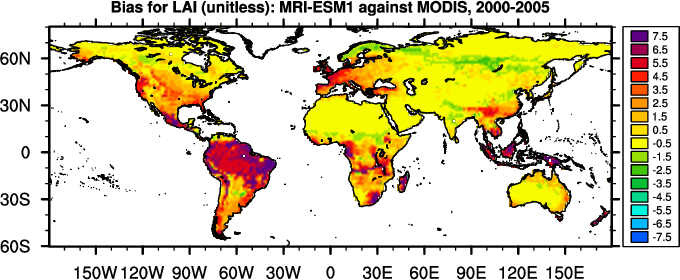
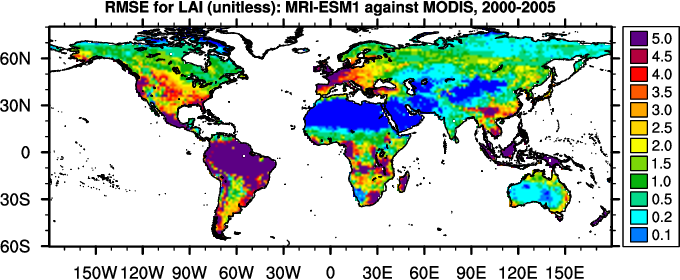
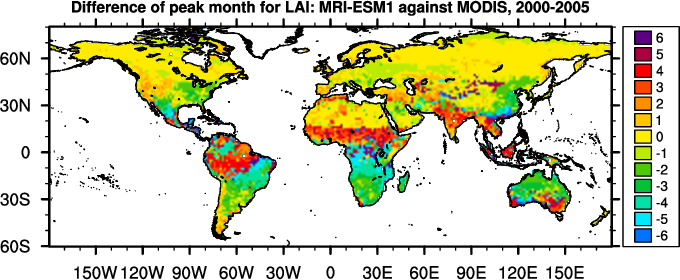
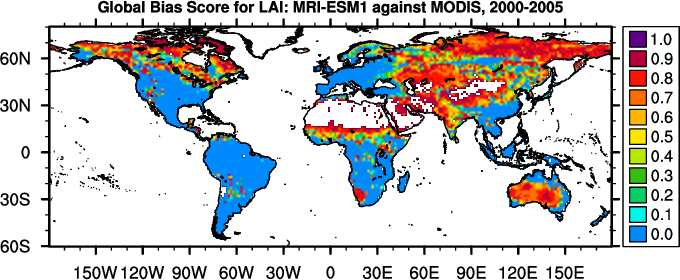
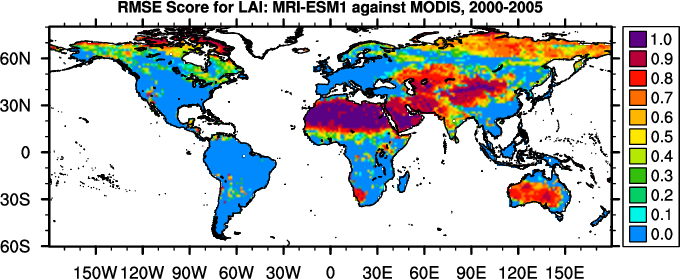
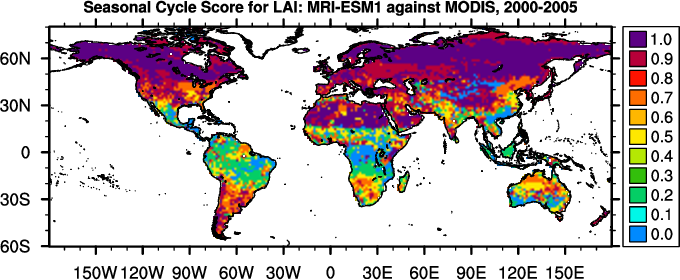
Diagnostic Summary for Leaf Area Index: Model vs. MODIS
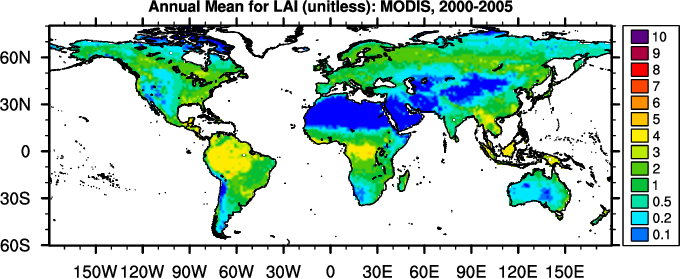
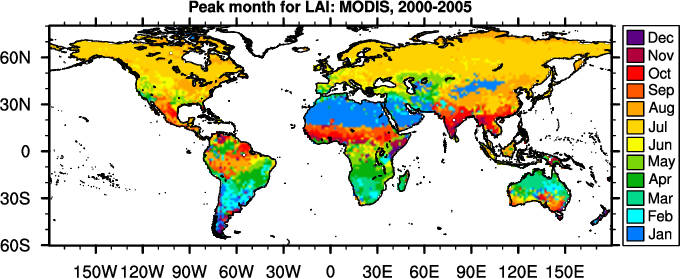
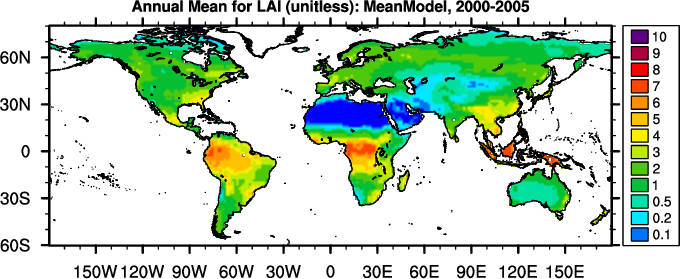
Global Patterns
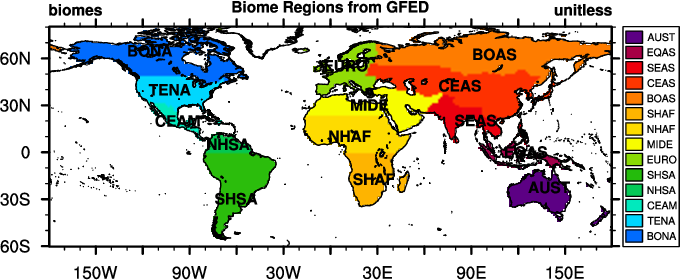
Regional Patterns
Scoring
(
Info
)
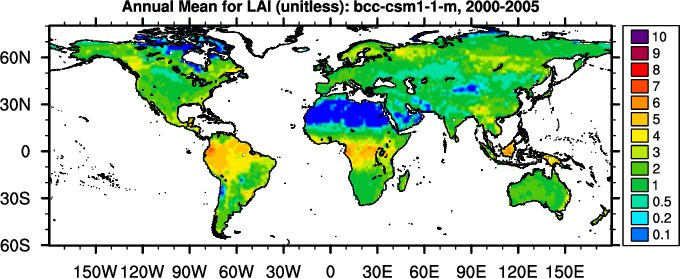
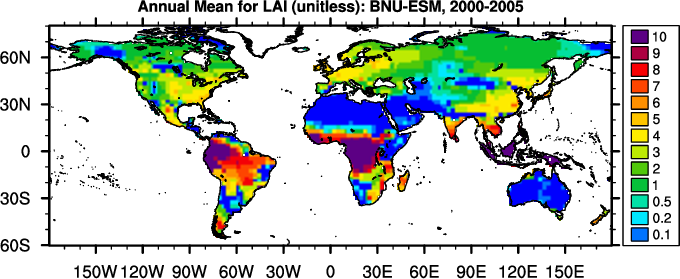
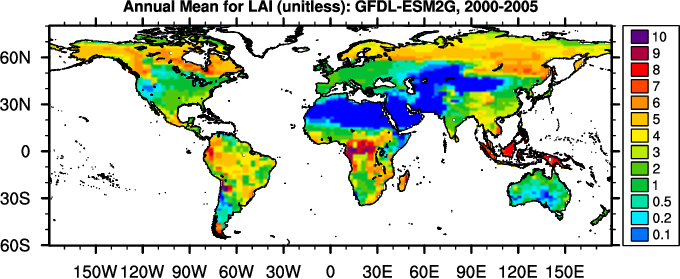
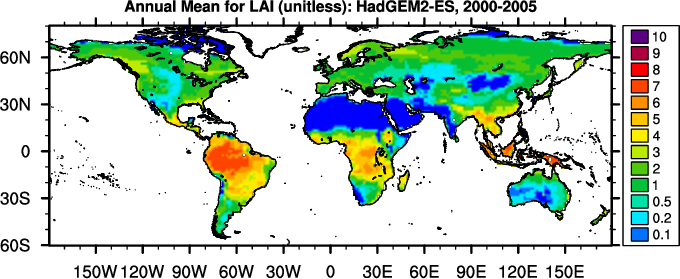
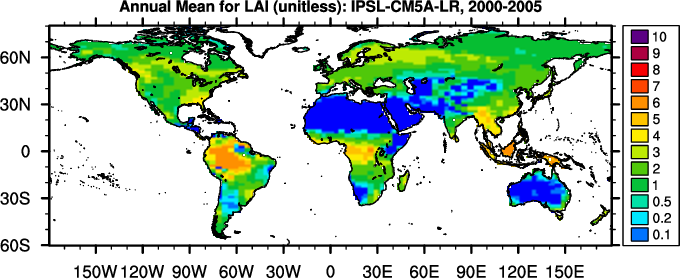
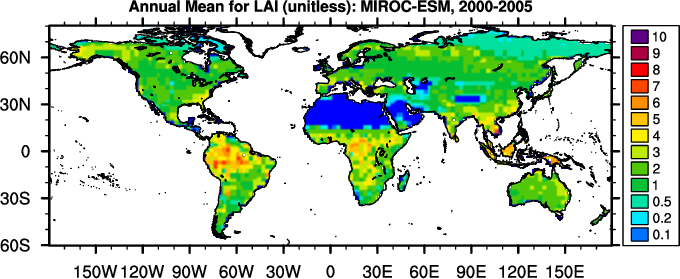
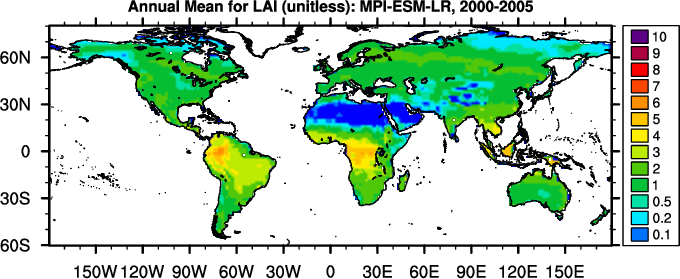
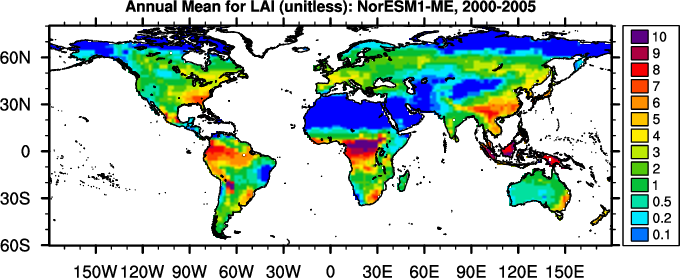
Annual Mean (unitless)
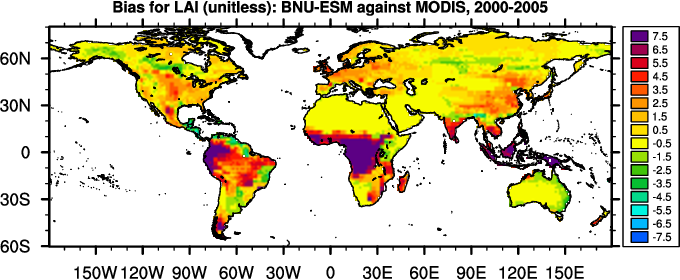
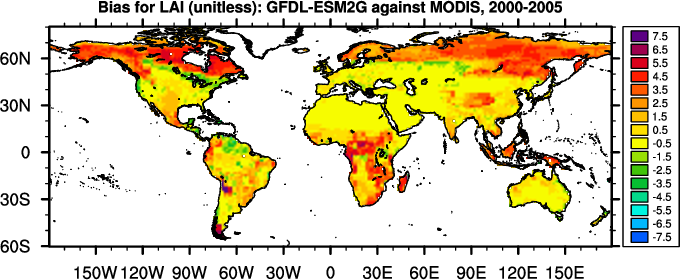
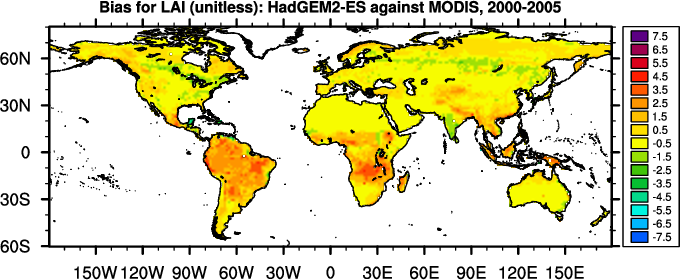
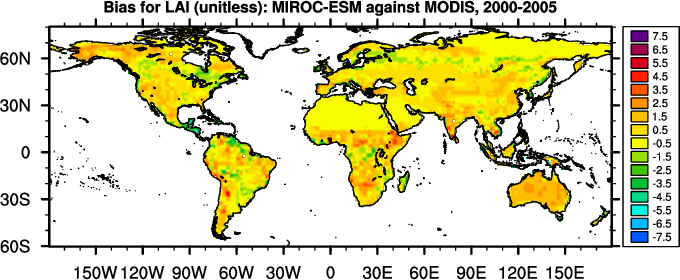
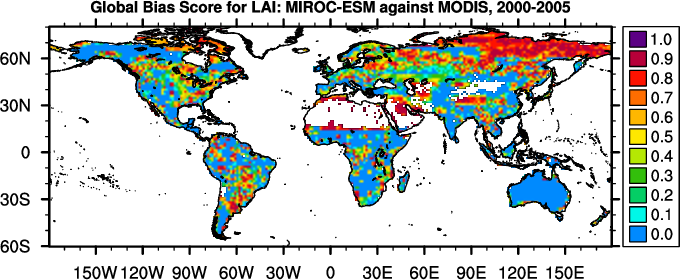
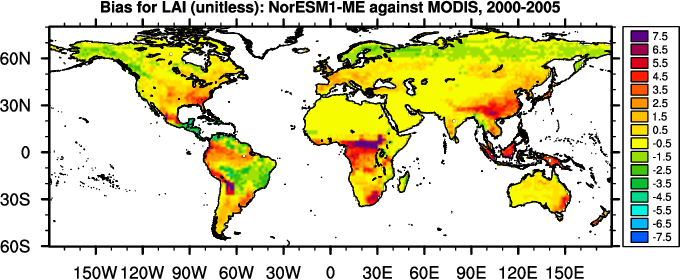
Bias (unitless)
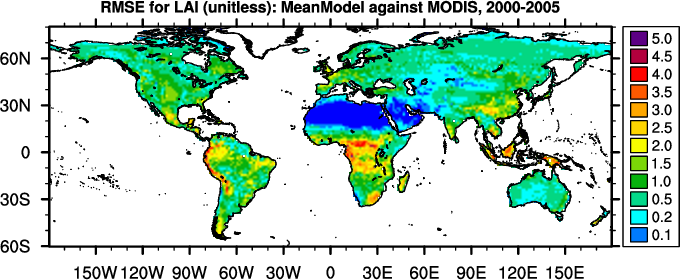
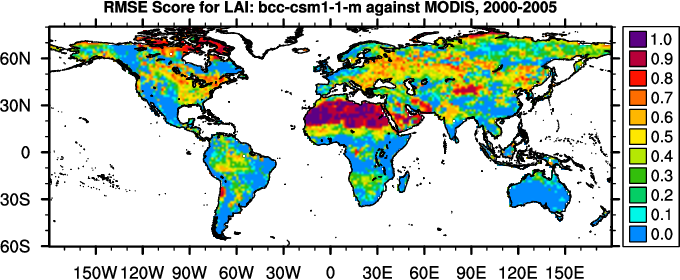
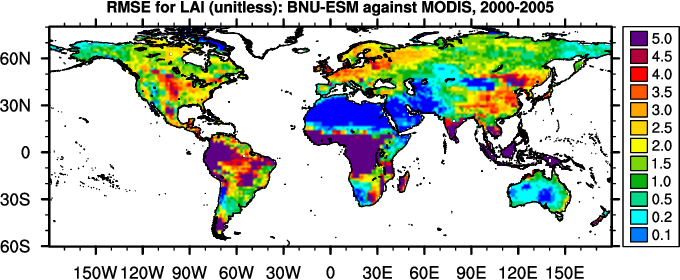
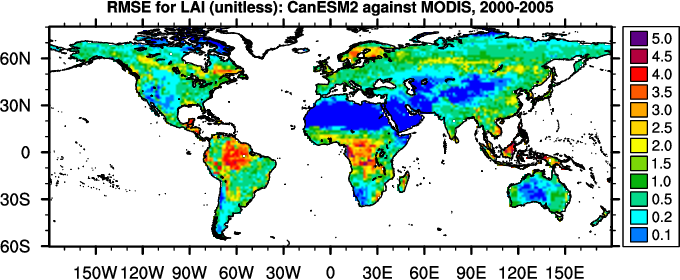
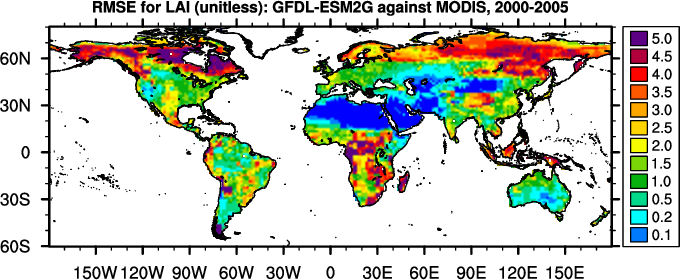
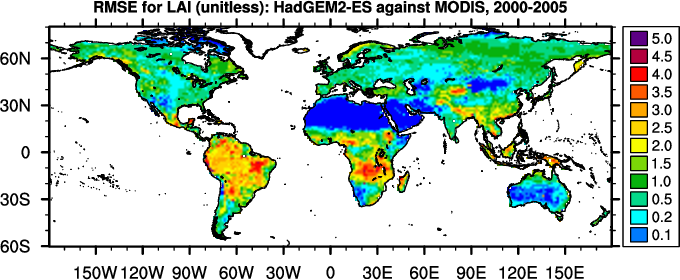
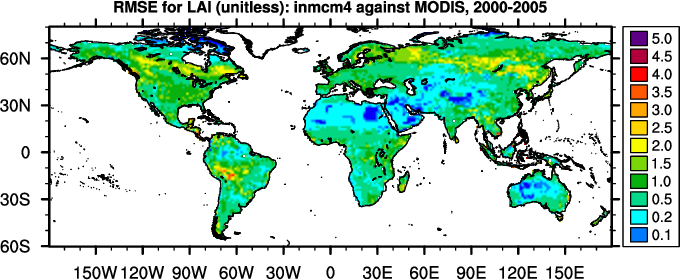
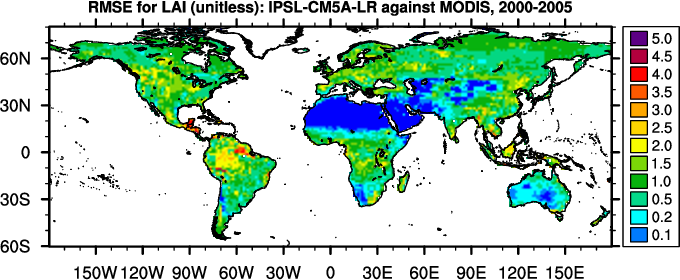
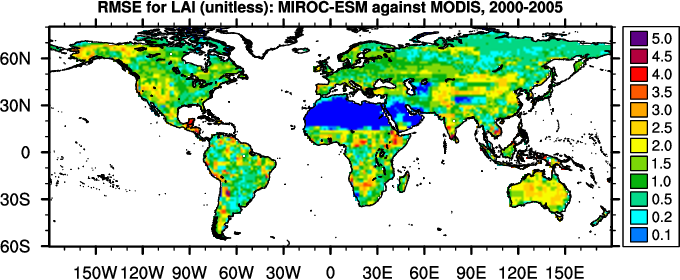
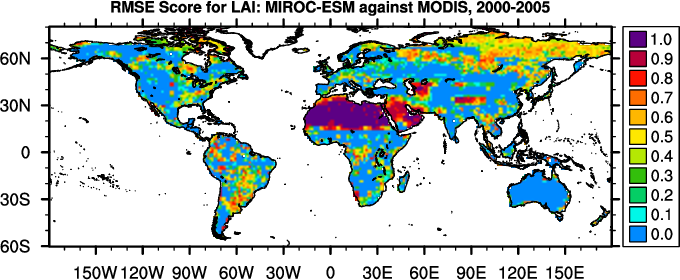
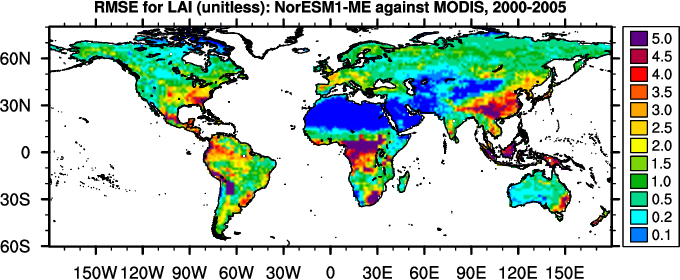
RMSE (unitless)
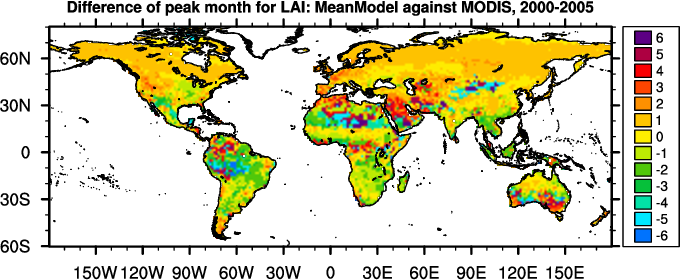
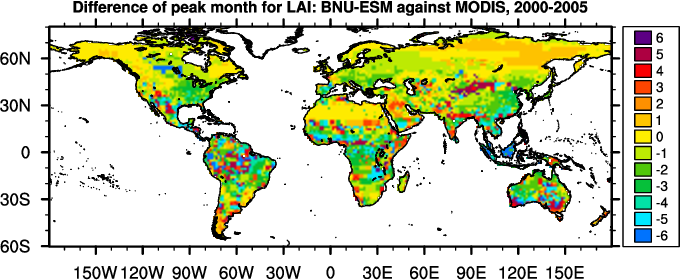
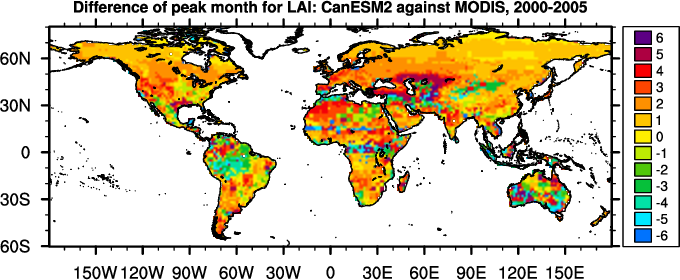
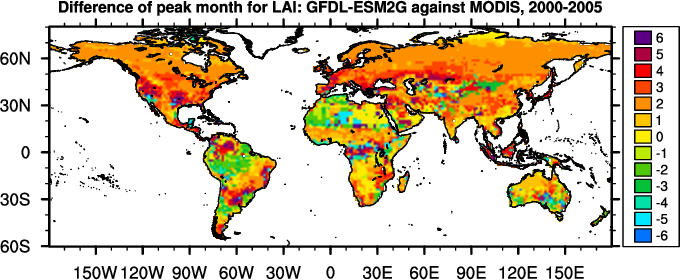
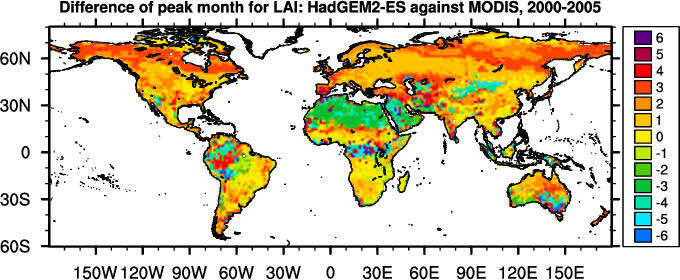
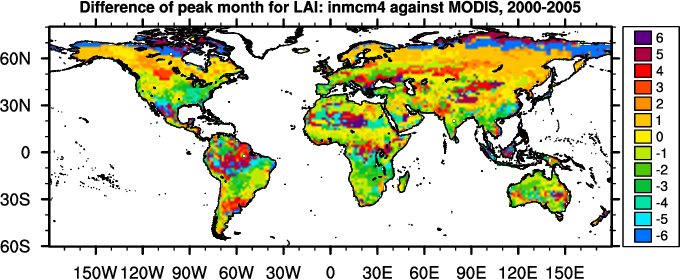
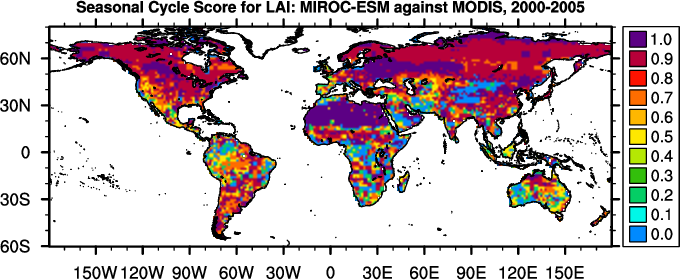
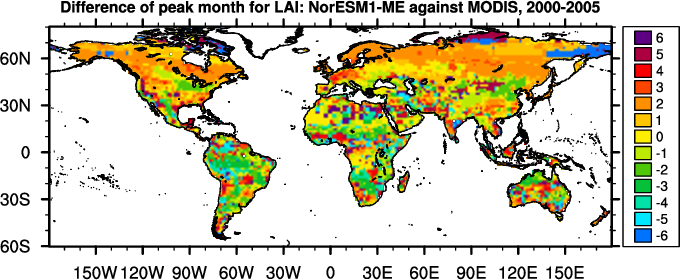
Phase Change (months)
Regional
Mean
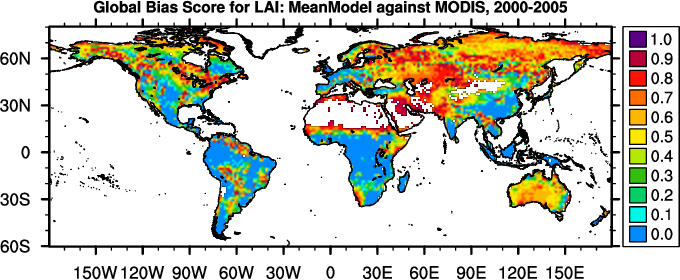
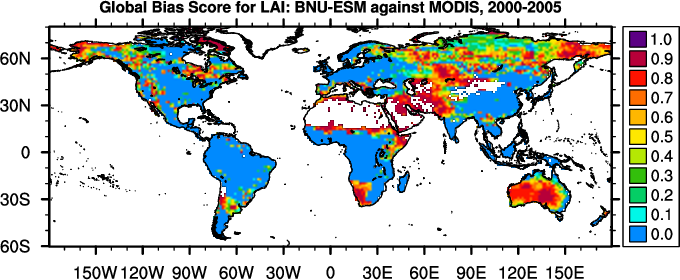
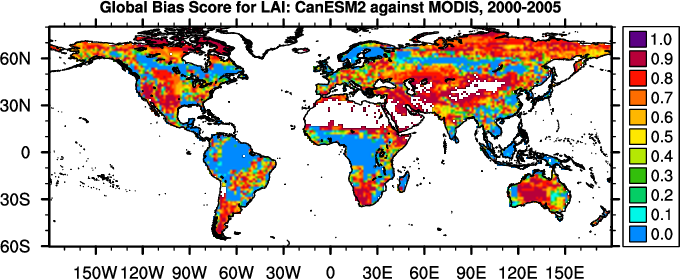
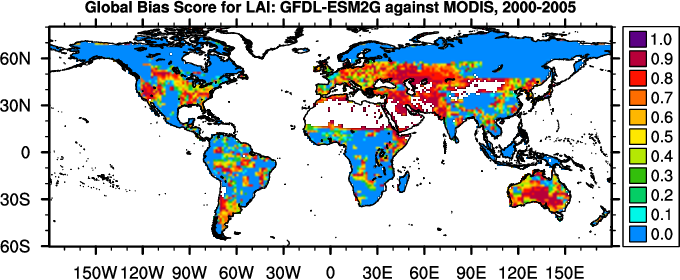
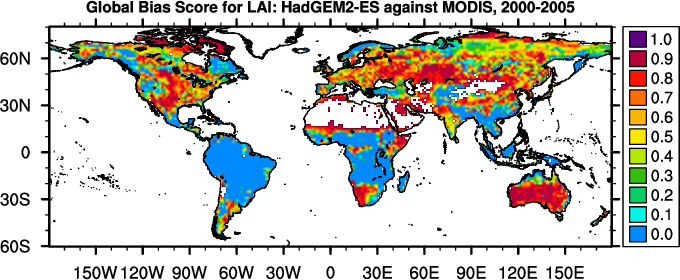
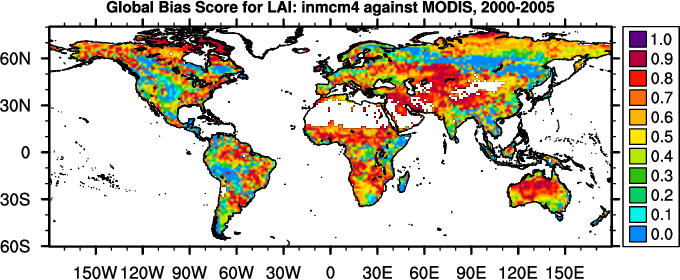
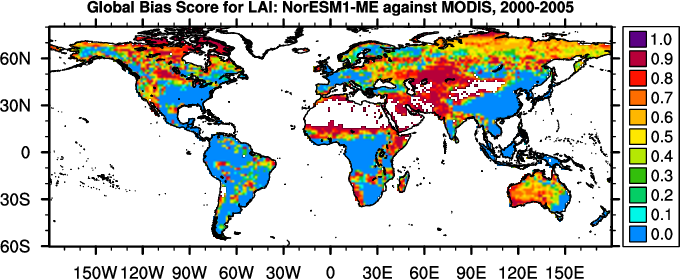
Global Bias
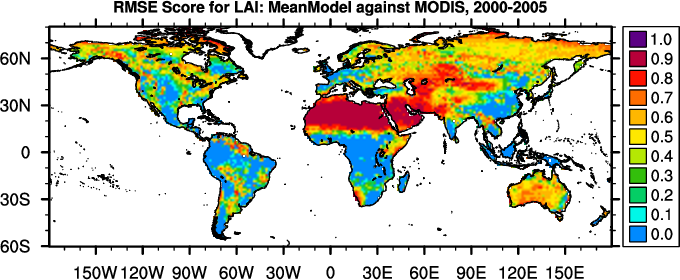
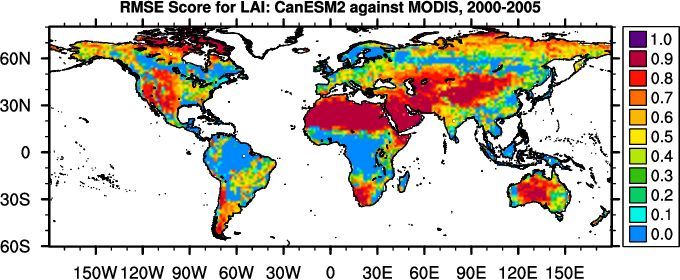
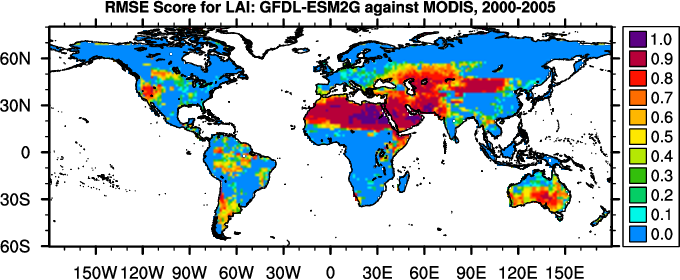
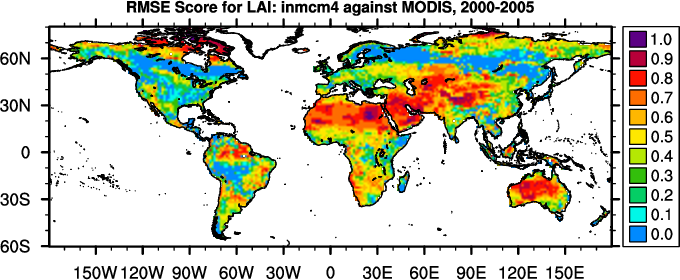
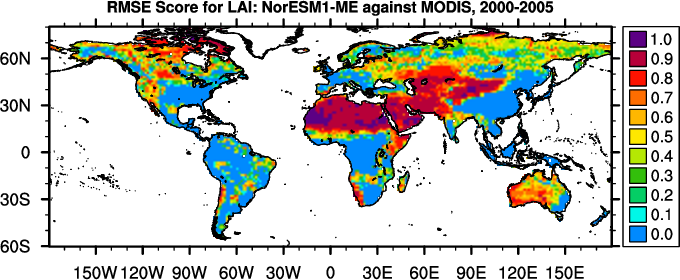
RMSE
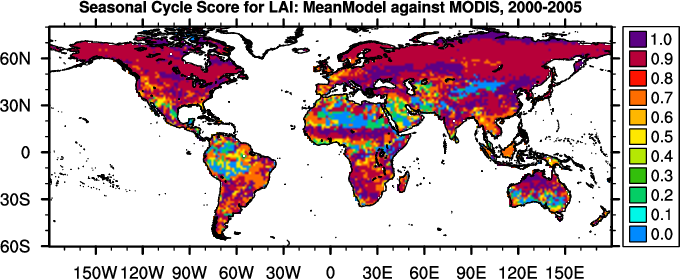
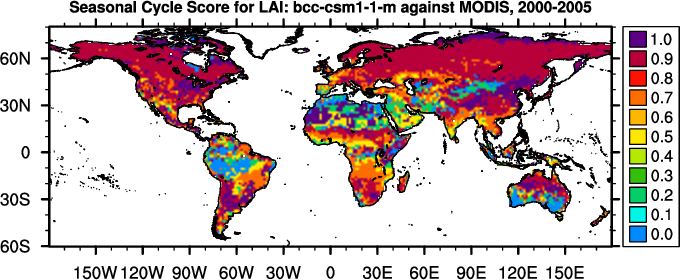
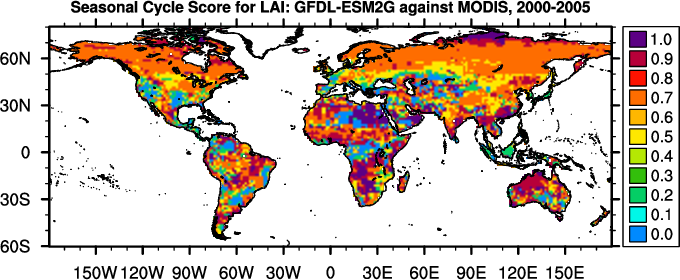
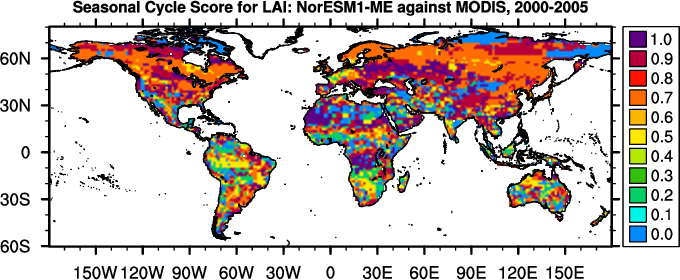
Seasonal Cycle
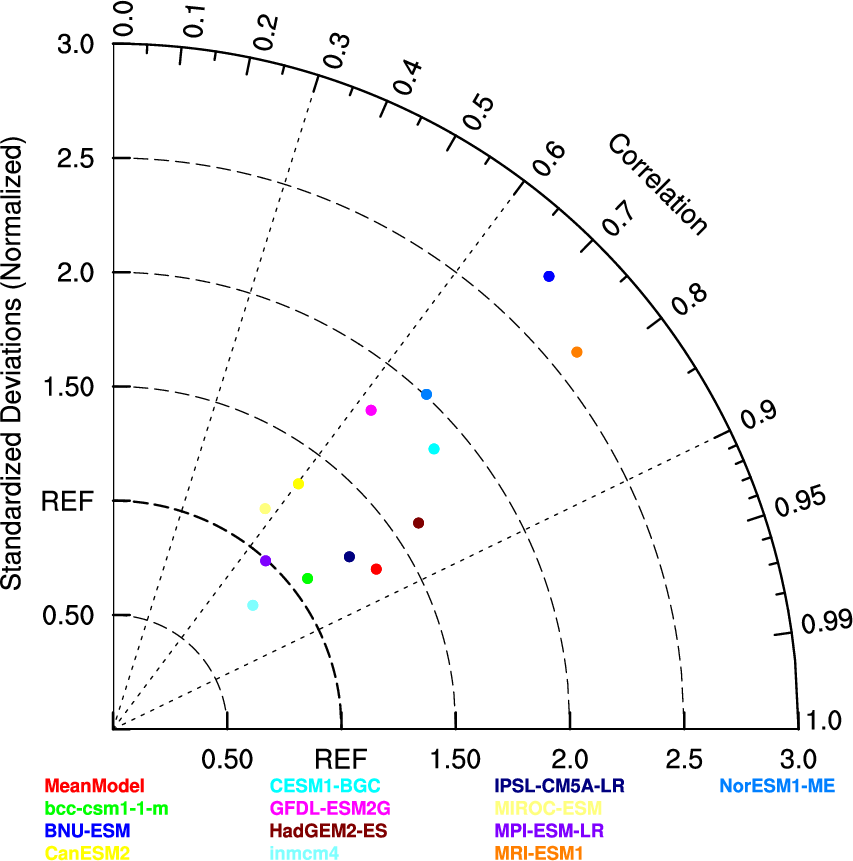
Spatial Distribution
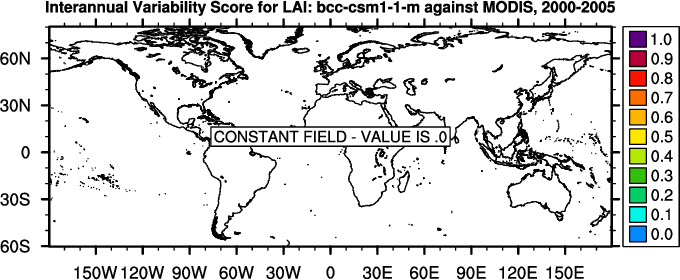
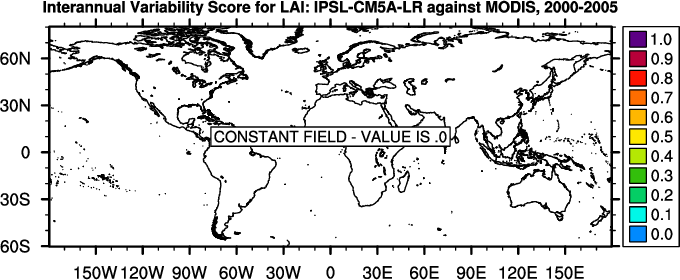
Interannual Variability
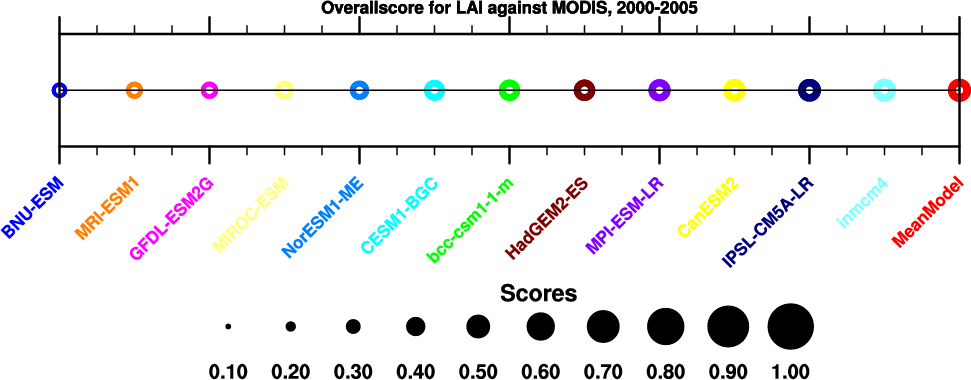
Overall
Benchmark
[De Kauwe et al. (2011)]
1.38
-
-
0.00
access to
plots
-
-
-
-
-
-
MeanModel
2.20
0.81
1.00
0.10
access to
plots
0.38
0.45
0.77
0.85
0.00
0.48
bcc-csm1-1-m
2.09
0.70
1.14
0.18
access to
plots
0.37
0.34
0.73
0.89
0.00
0.45
BNU-ESM
3.18
1.79
2.48
-0.75
access to
plots
0.27
0.29
0.69
0.35
0.00
0.31
CanESM2
1.40
0.02
1.05
0.90
access to
plots
0.45
0.49
0.65
0.73
0.00
0.47
CESM1-BGC
2.18
0.80
1.31
0.34
access to
plots
0.40
0.46
0.67
0.61
0.00
0.43
GFDL-ESM2G
2.87
1.49
2.00
1.30
access to
plots
0.30
0.29
0.65
0.59
0.00
0.35
HadGEM2-ES
2.22
0.84
1.18
0.67
access to
plots
0.39
0.44
0.69
0.73
0.00
0.45
inmcm4
1.31
-0.08
0.90
-0.28
access to
plots
0.49
0.47
0.62
0.84
0.00
0.48
IPSL-CM5A-LR
1.88
0.50
0.99
0.32
access to
plots
0.40
0.43
0.75
0.85
0.00
0.48
MIROC-ESM
2.06
0.68
1.39
0.42
access to
plots
0.30
0.31
0.71
0.76
0.00
0.40
MPI-ESM-LR
1.74
0.36
1.02
0.34
access to
plots
0.39
0.41
0.71
0.84
0.00
0.46
MRI-ESM1
3.17
1.79
2.22
-0.23
access to
plots
0.32
0.35
0.69
0.39
0.00
0.35
NorESM1-ME
2.28
0.90
1.51
0.34
access to
plots
0.37
0.42
0.64
0.54
0.00
0.40
Notes: In calculating overall score, rmse score contributes double in comparison with all other scores.