Output for ILAMB Diagnostics
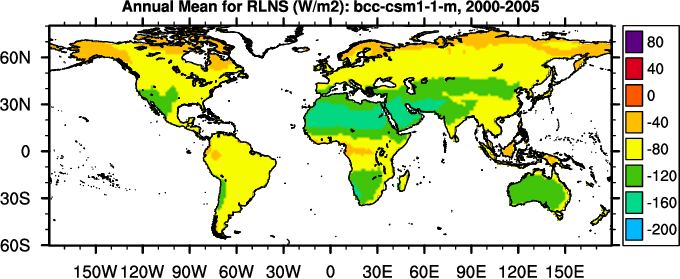
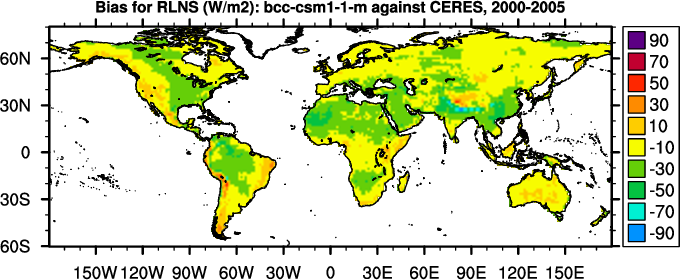
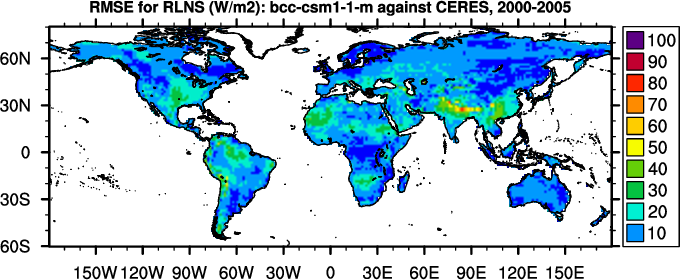
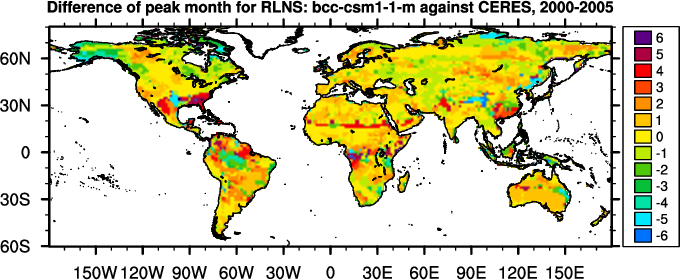
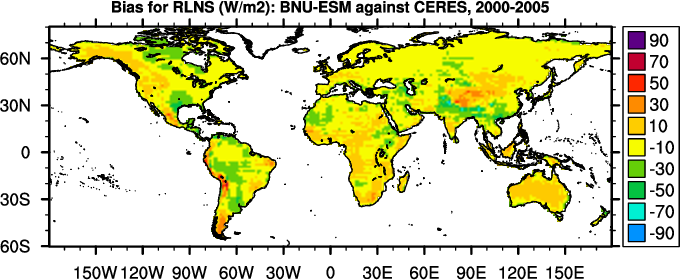
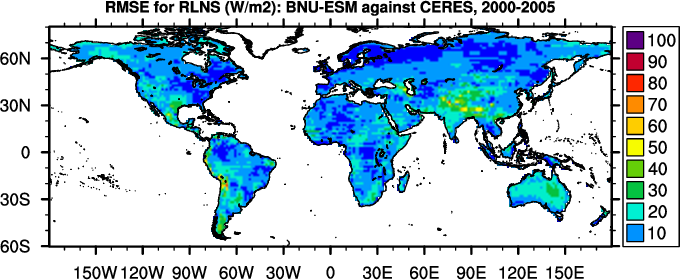
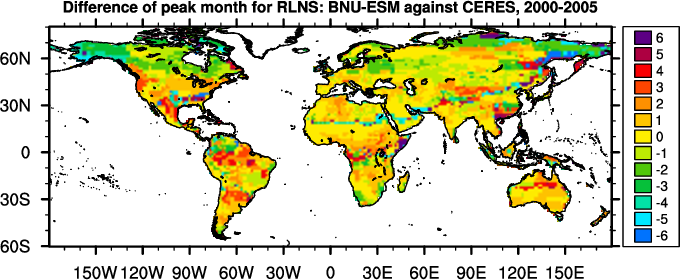
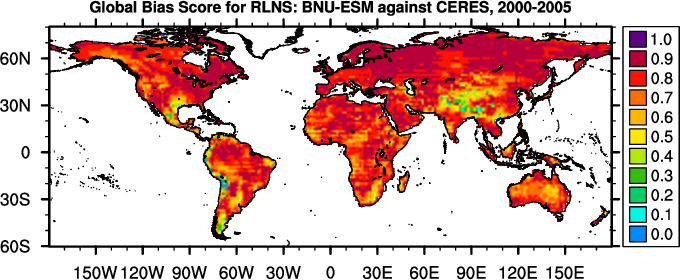
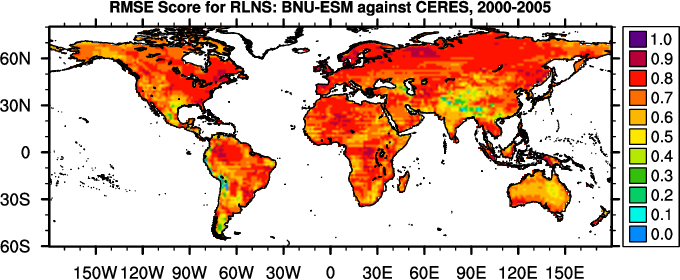
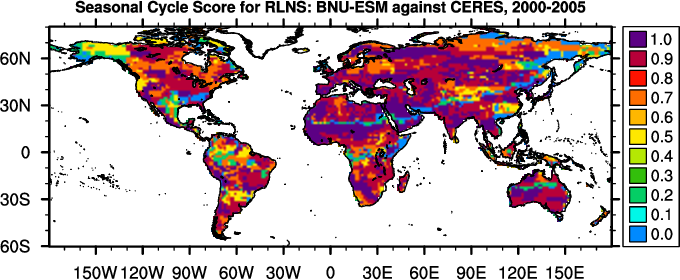
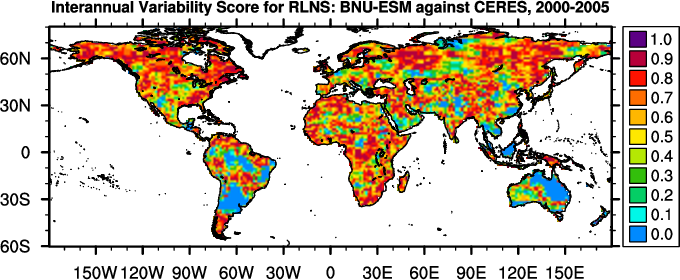
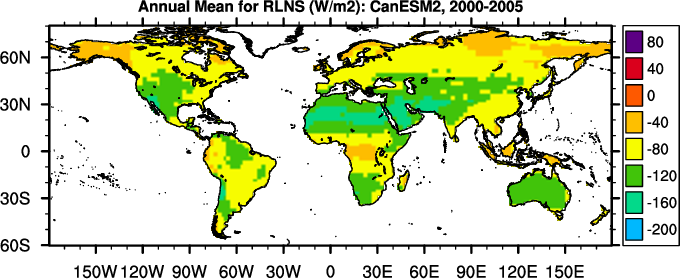
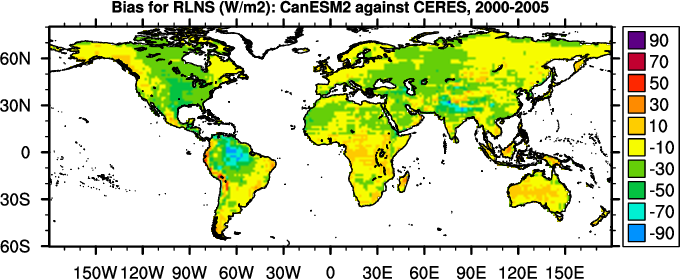
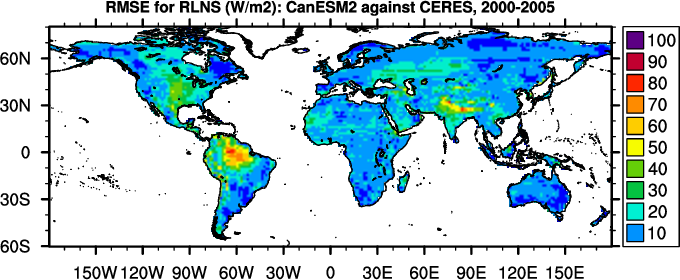
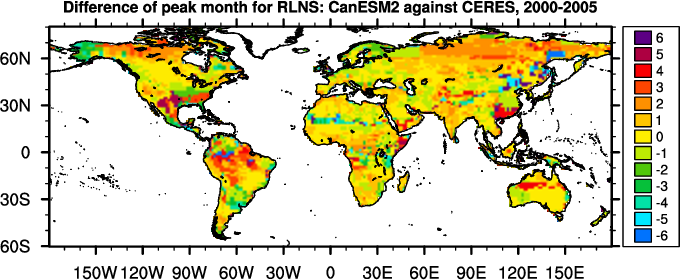
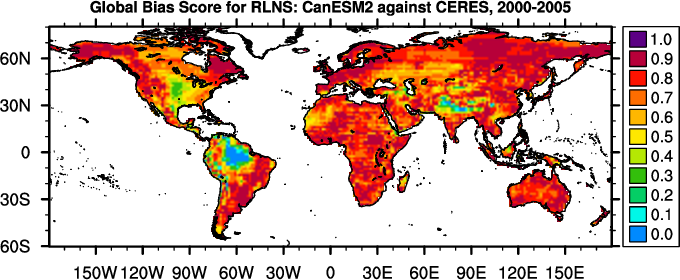
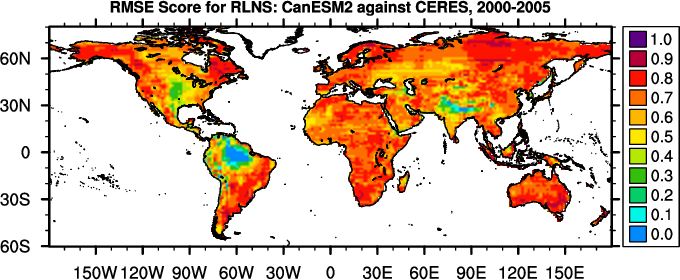
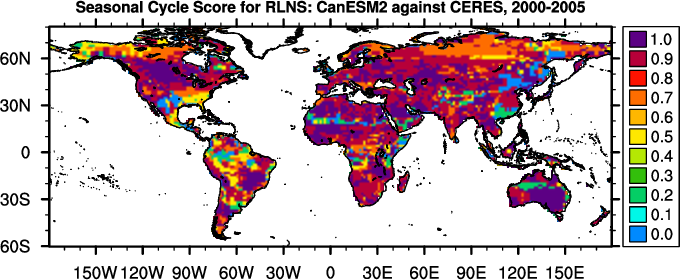
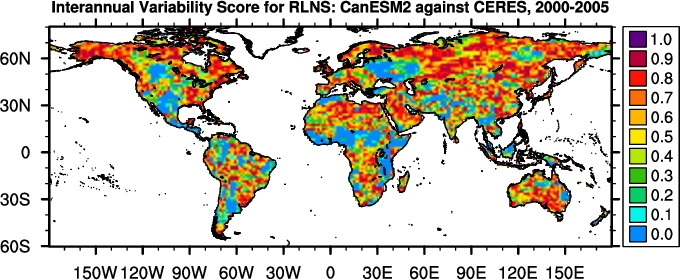
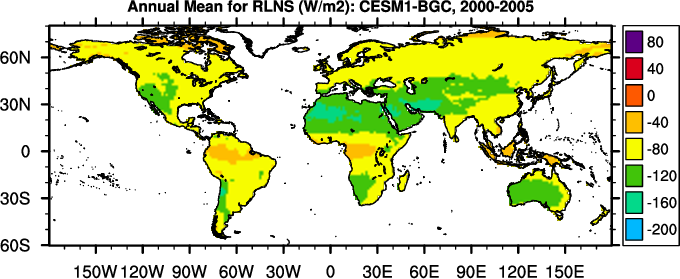
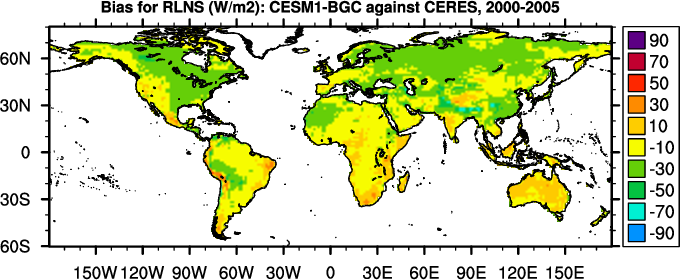
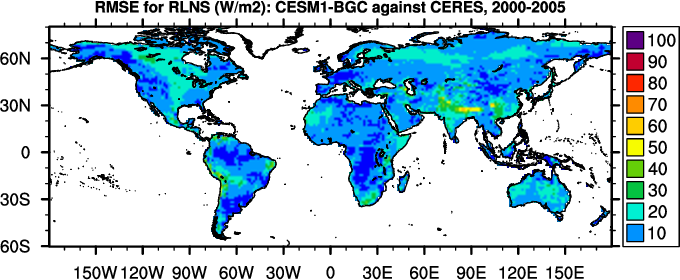
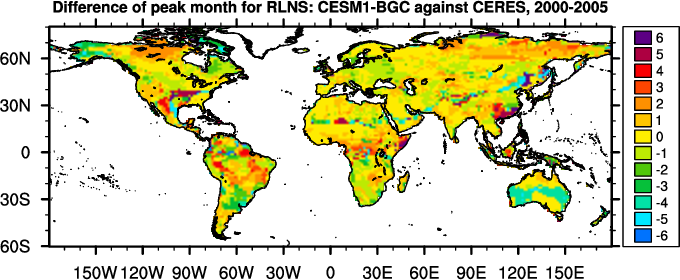
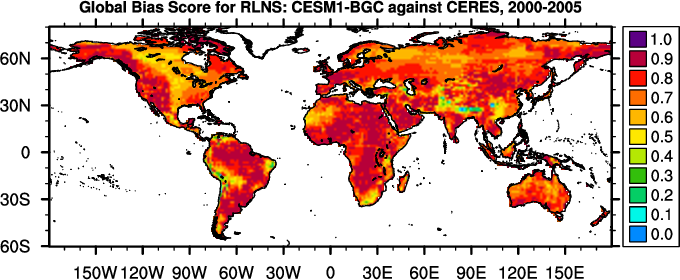
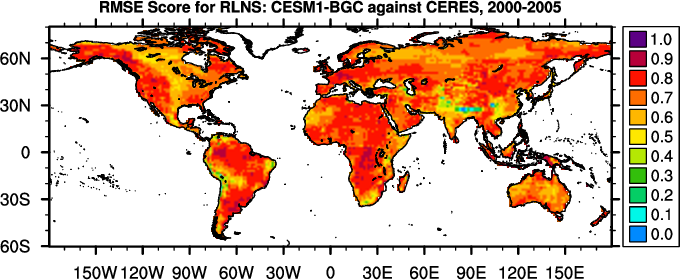
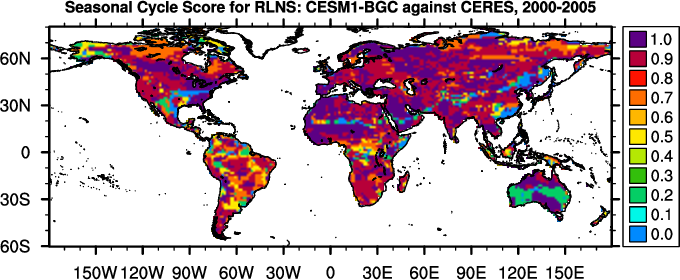
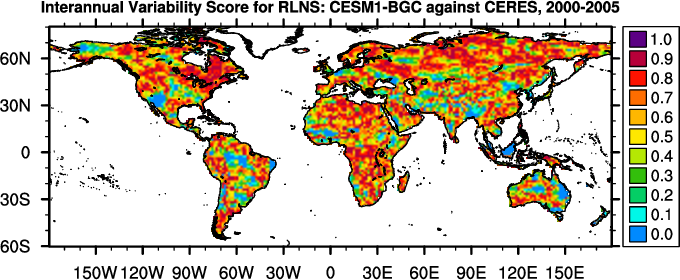
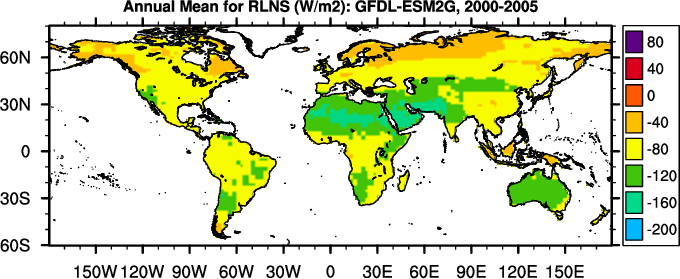
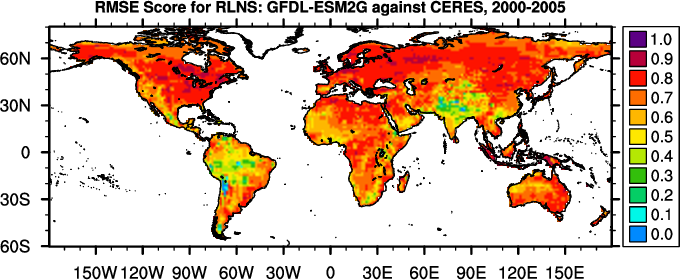
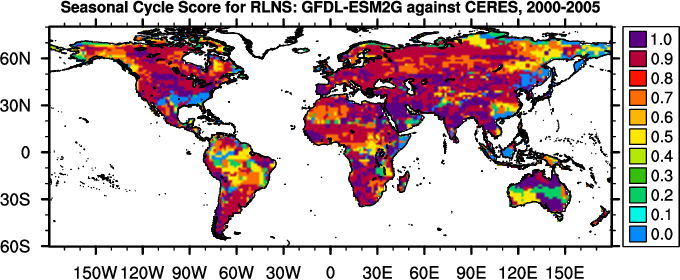
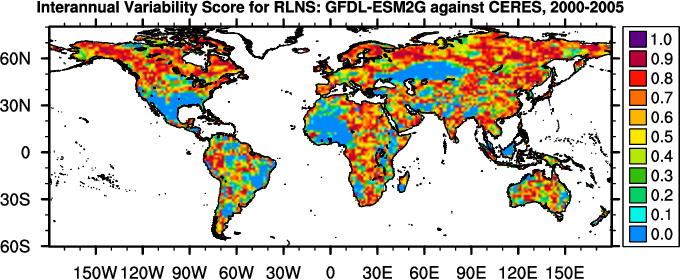
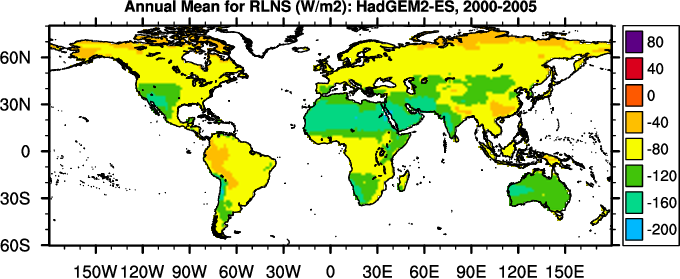
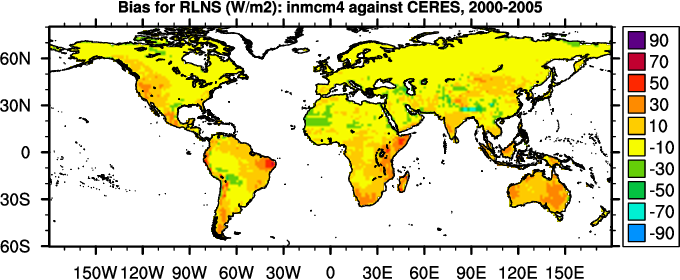
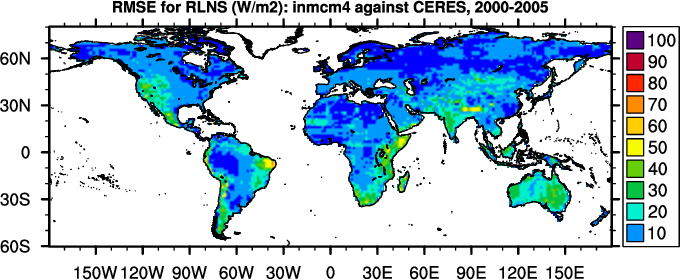
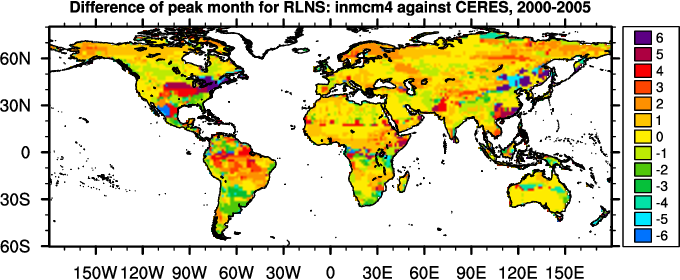
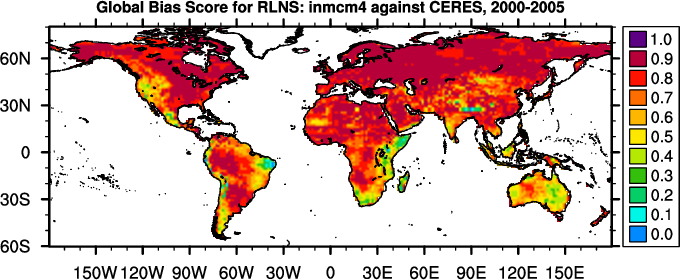
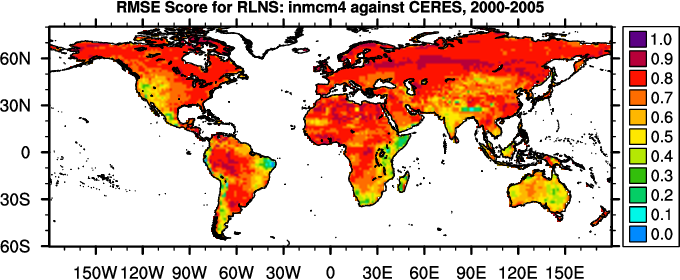
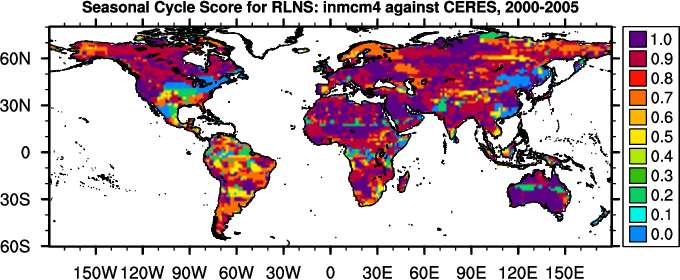
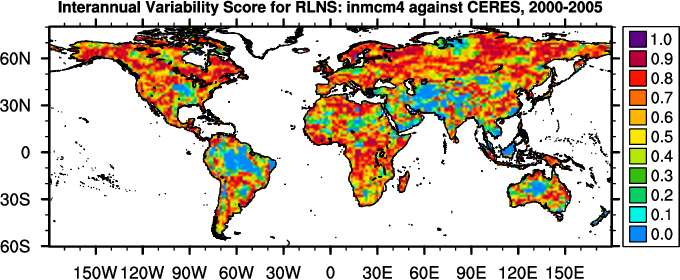
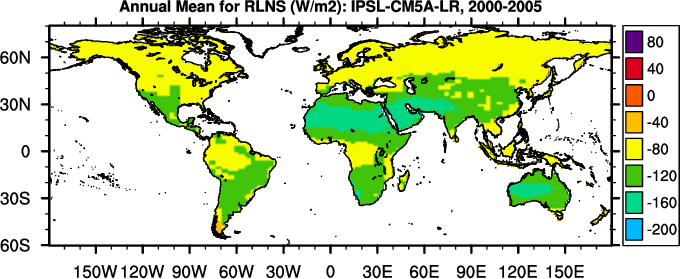
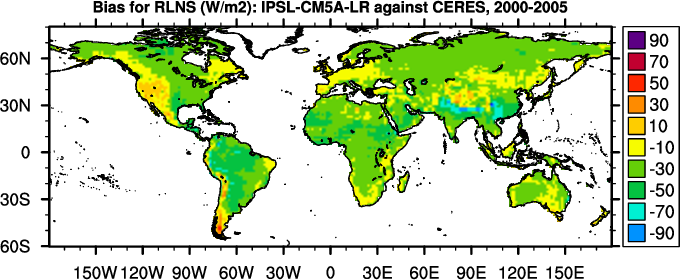
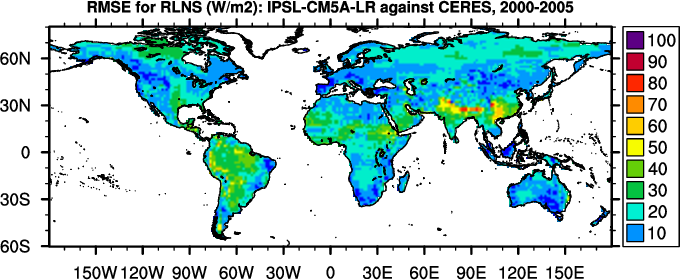
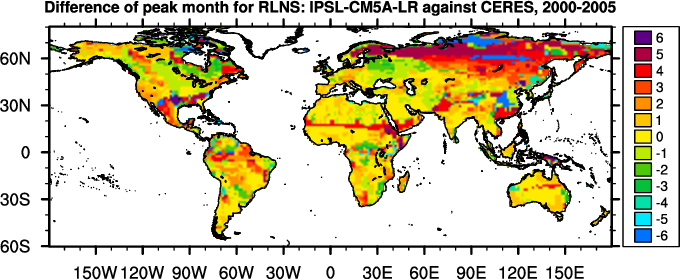
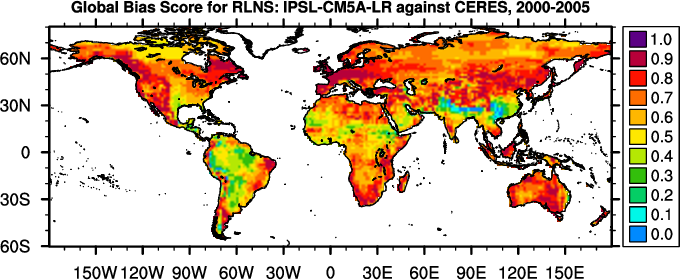
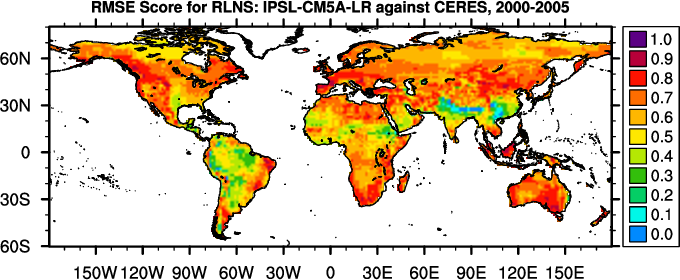
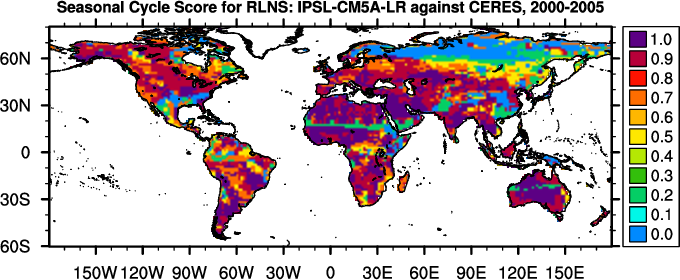
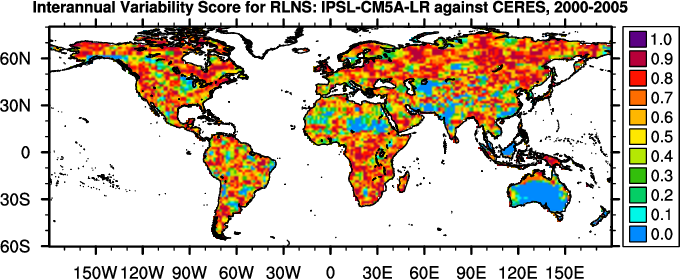
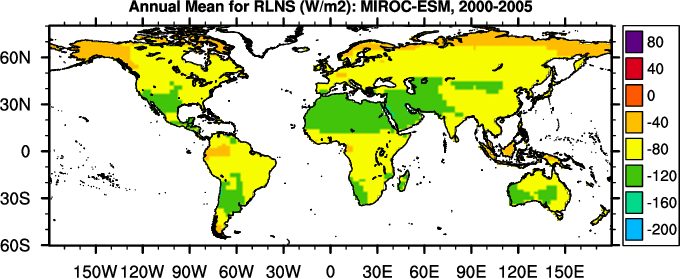
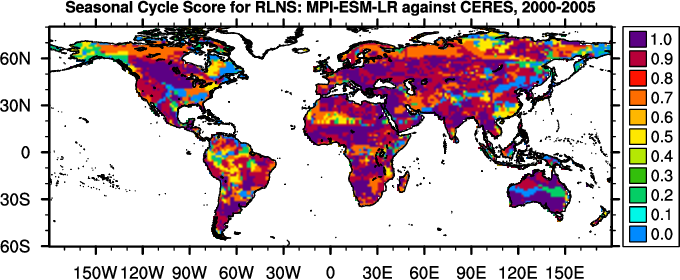
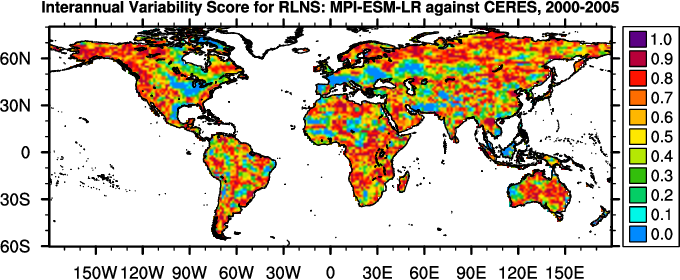
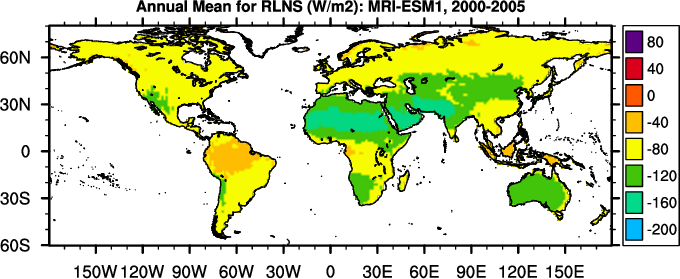
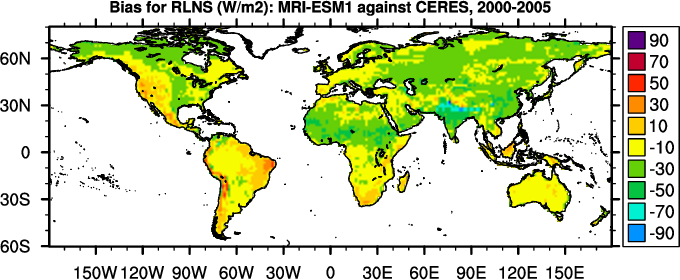
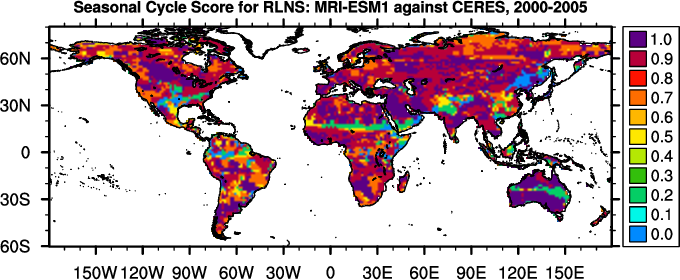
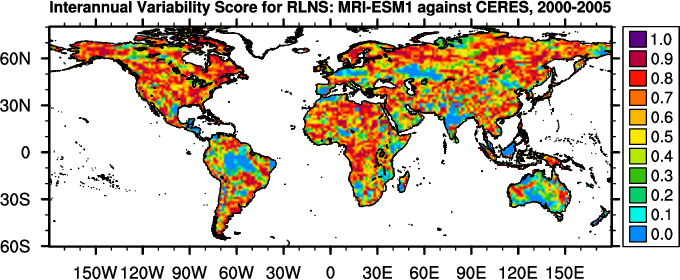
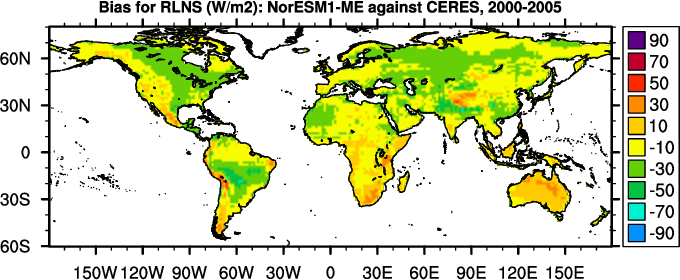
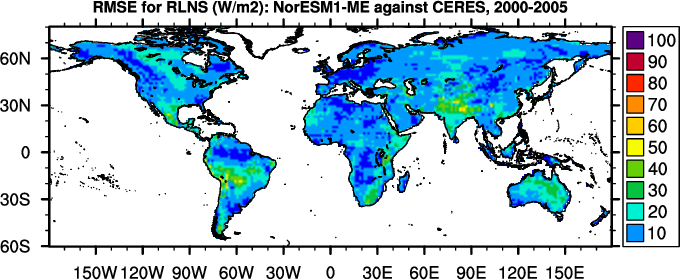
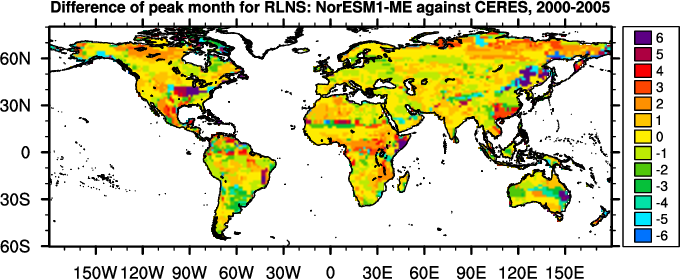
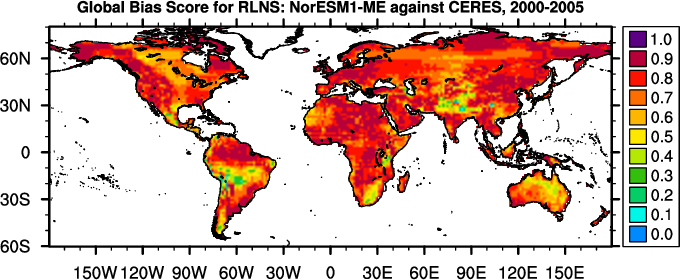
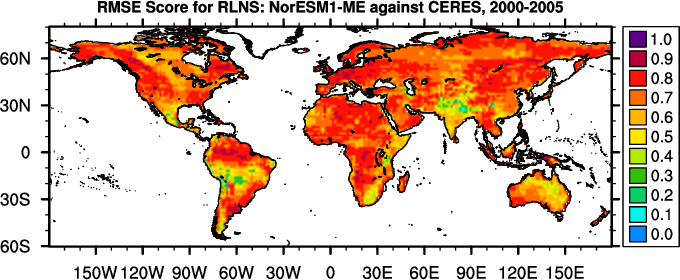
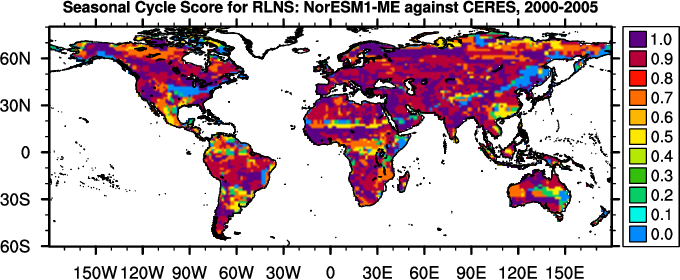
Diagnostic Summary for Surface Net LW Radiation: Model vs. CERES
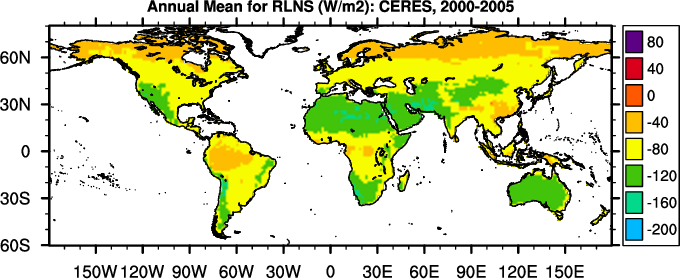
Global Patterns
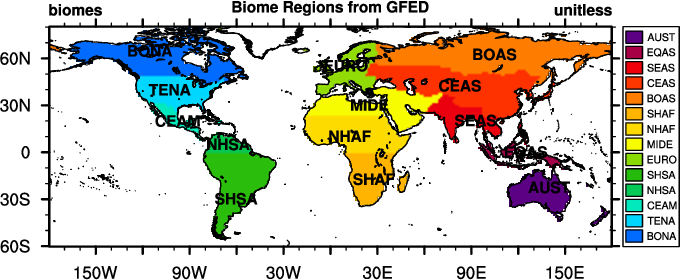
Regional Patterns
Scoring
(
Info
)
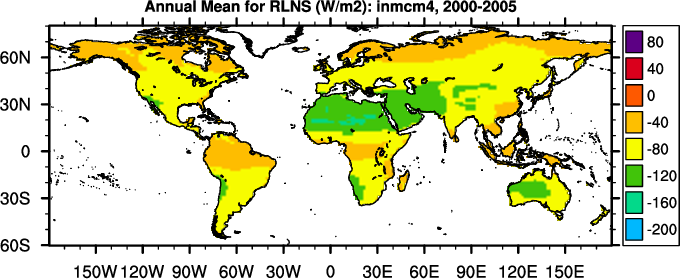
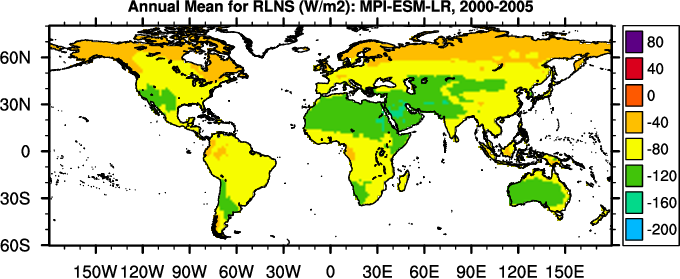
Annual Mean (W/m2)
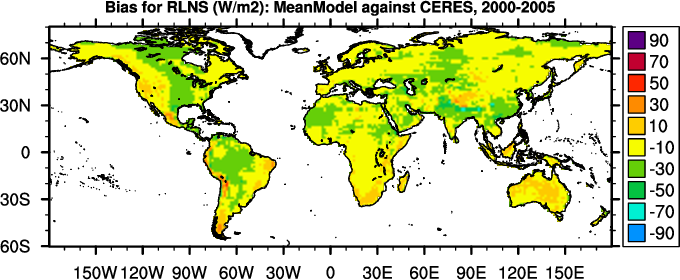
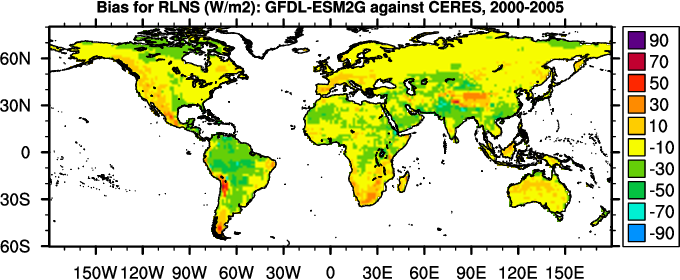
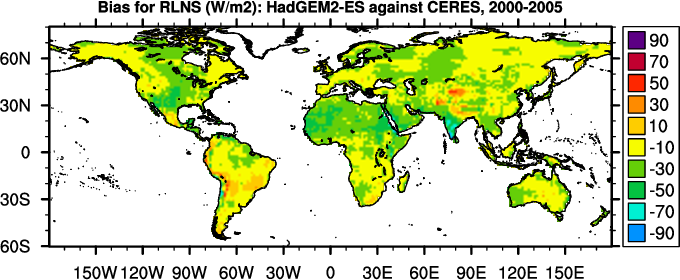
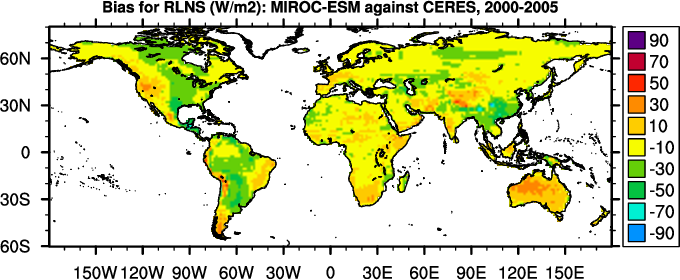
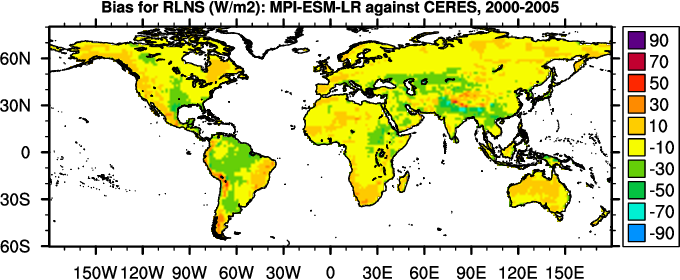
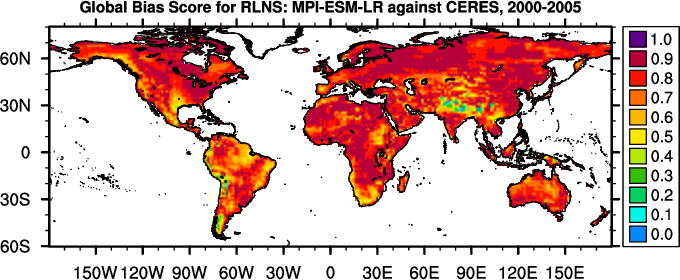
Bias (W/m2)
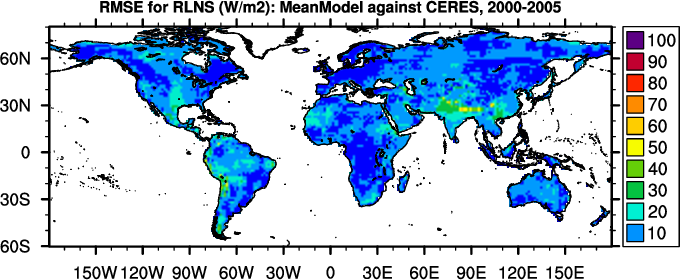
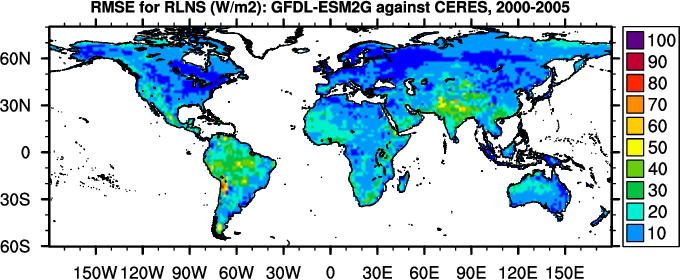
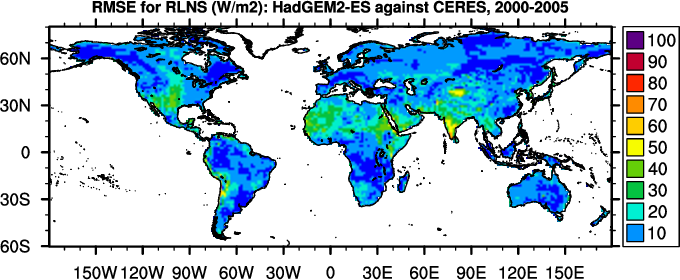
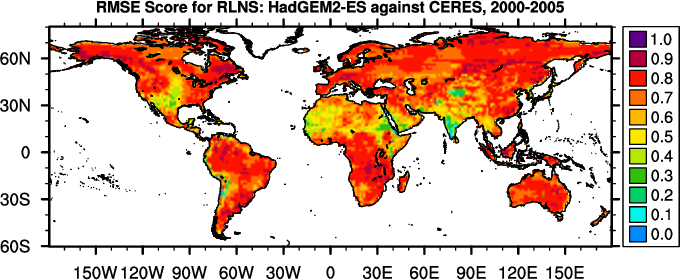
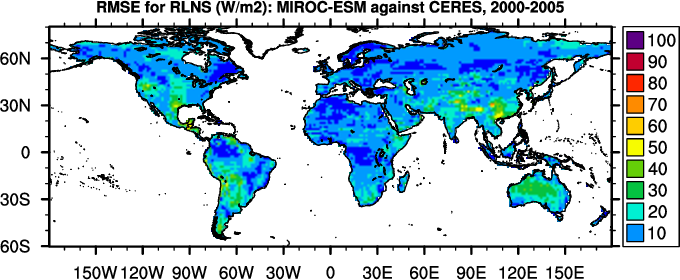
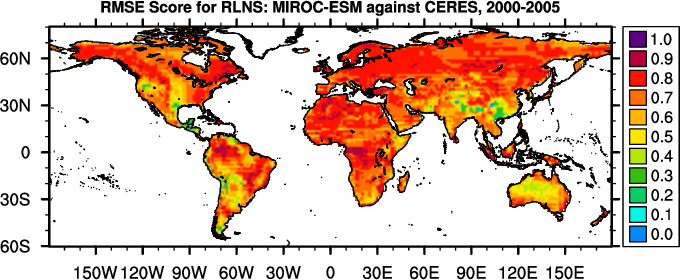
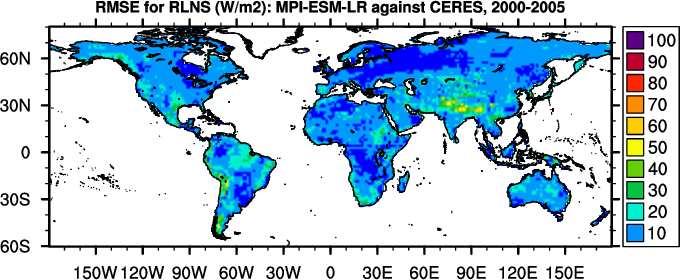
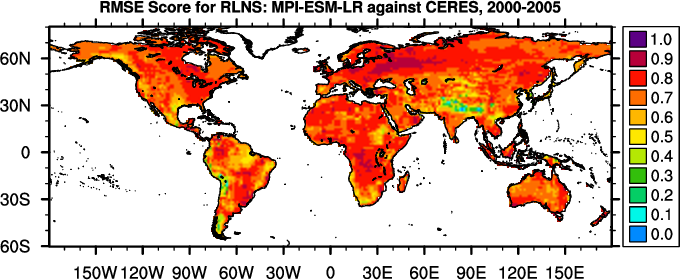
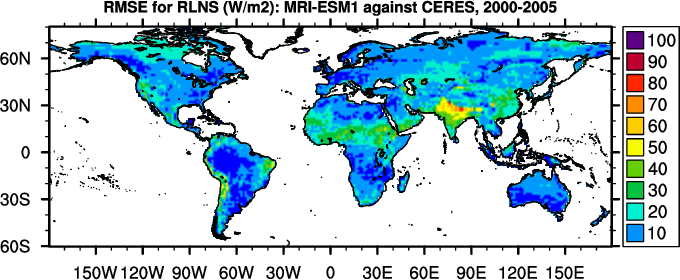
RMSE (W/m2)
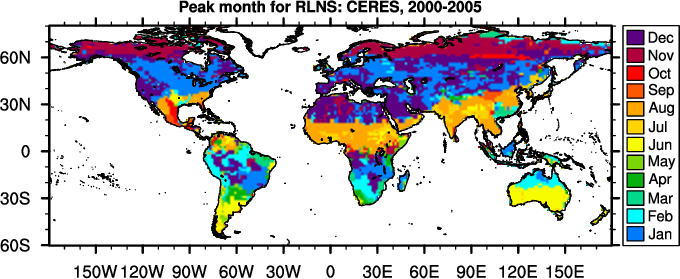
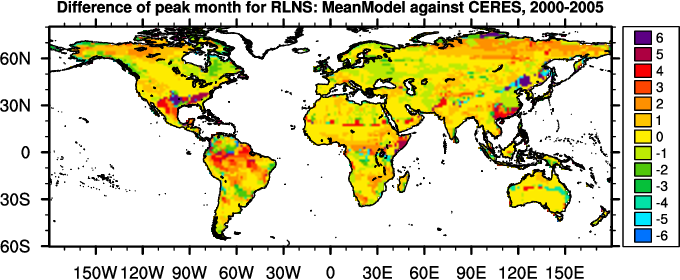
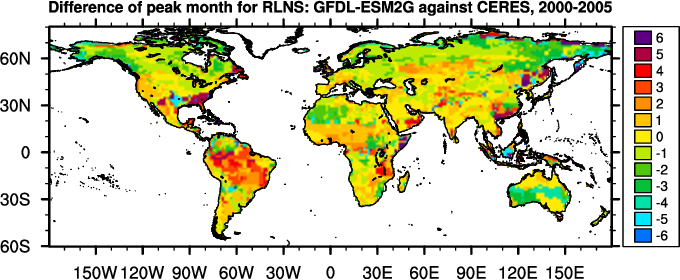
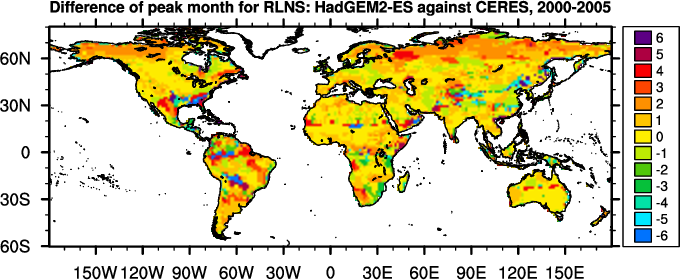
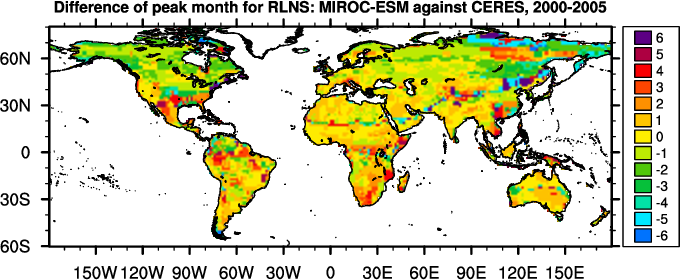
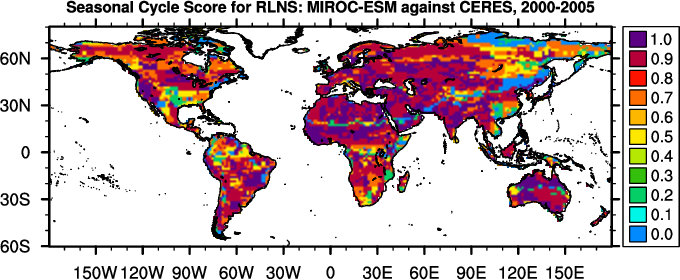
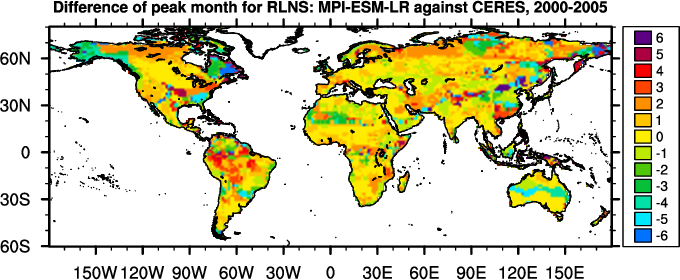
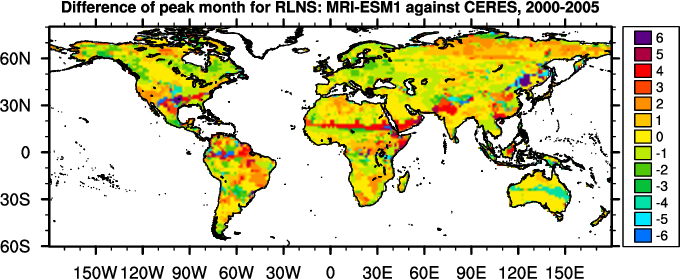
Phase Change (months)
Regional
Mean
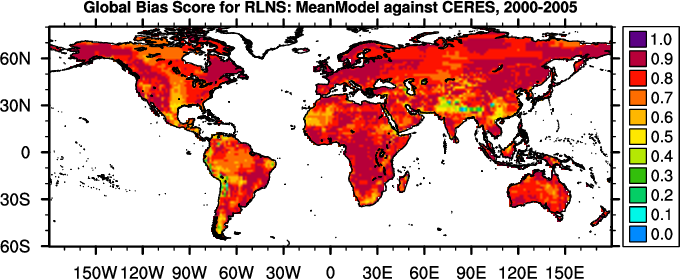
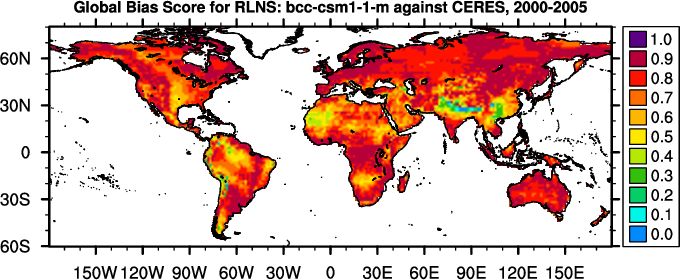
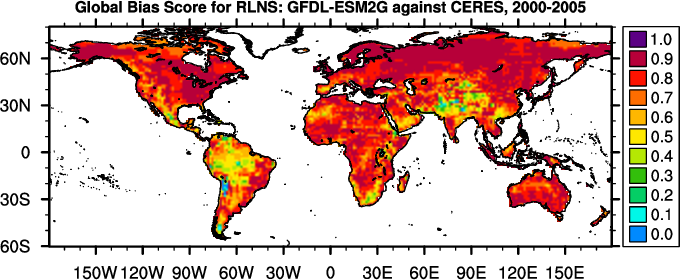
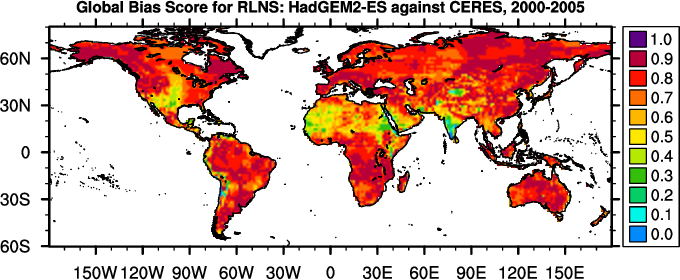
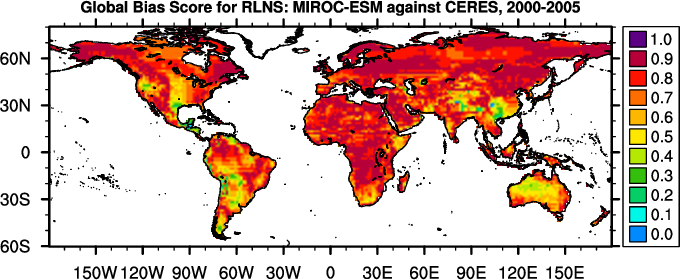
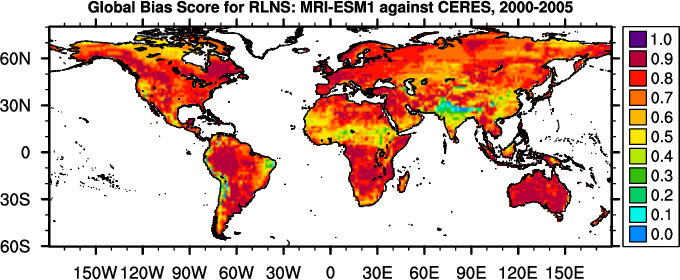
Global Bias
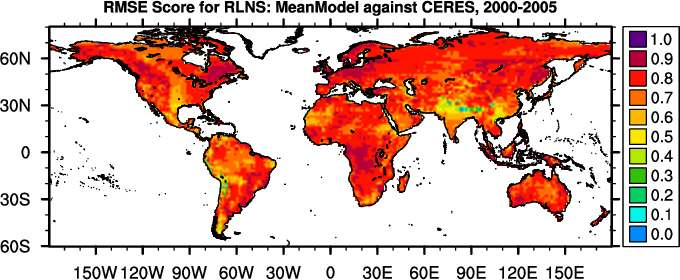
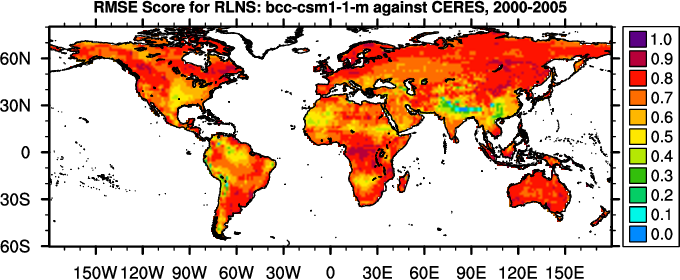
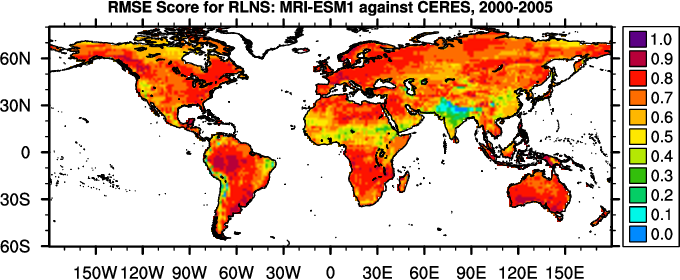
RMSE
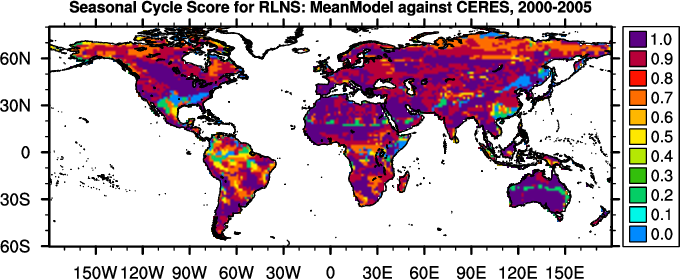
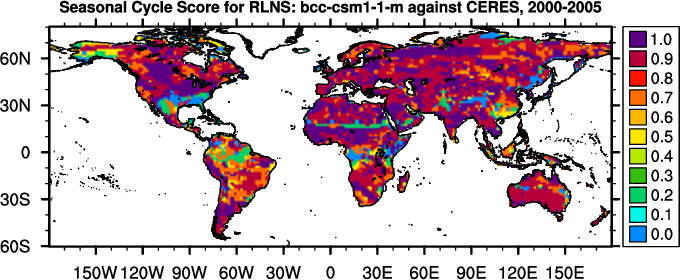
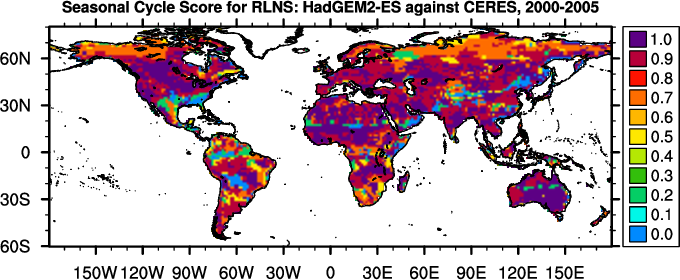
Seasonal Cycle
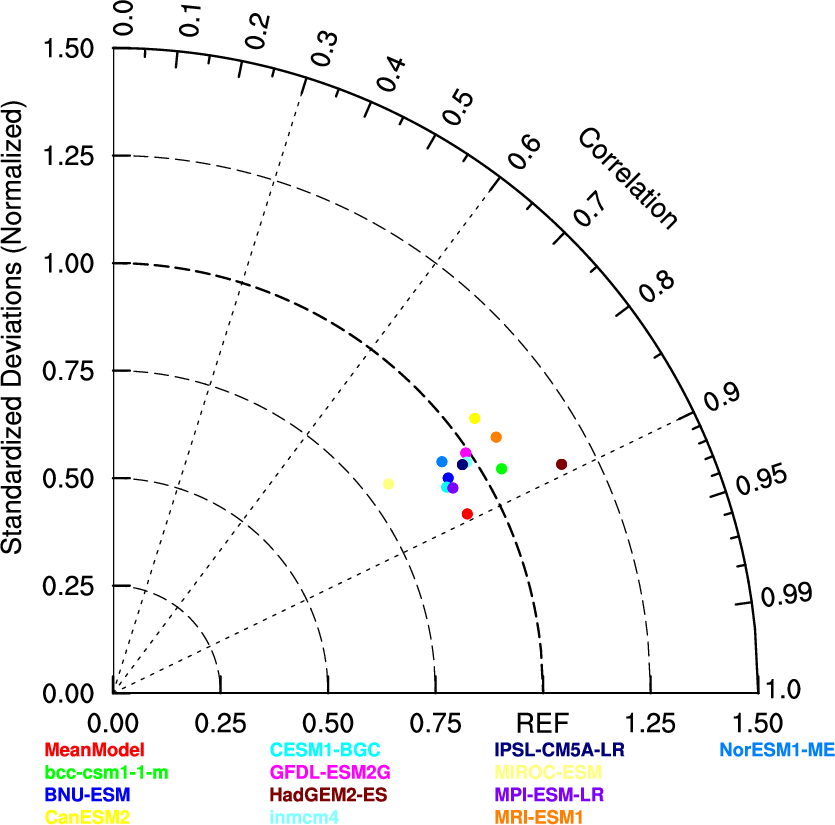
Spatial Distribution
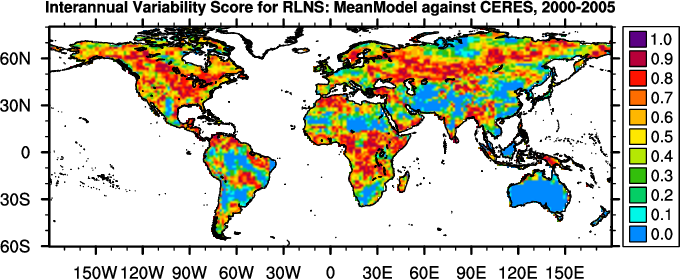
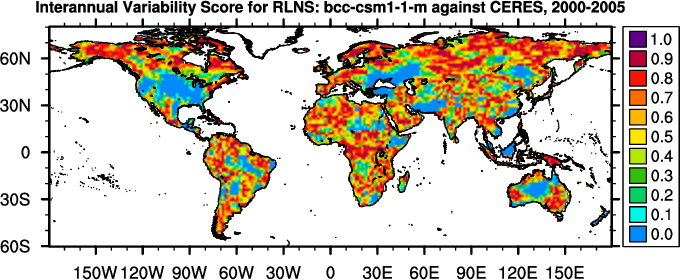
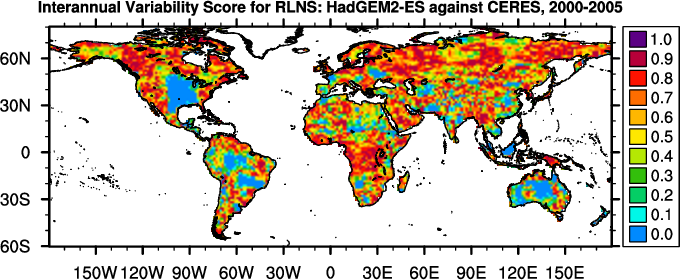
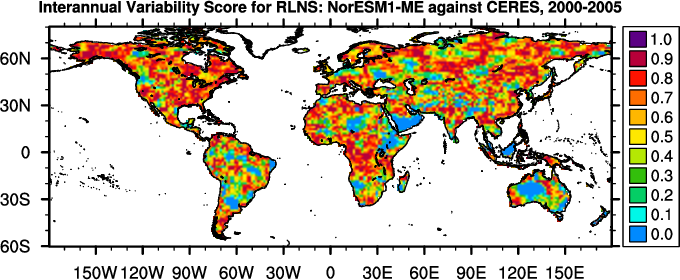
Interannual Variability
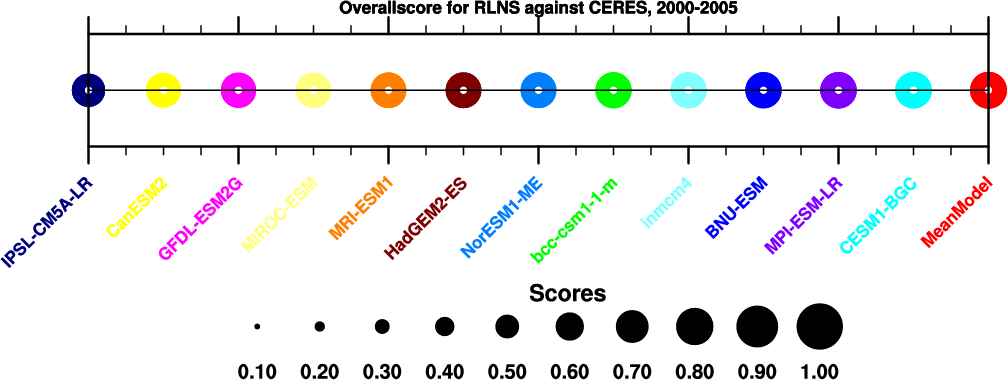
Overall
Benchmark
[Kato et al. (2013)]
-65.6
-
-
0.0
access to
plots
-
-
-
-
-
-
MeanModel
-70.6
-5.0
13.7
0.3
access to
plots
0.85
0.81
0.84
0.94
0.49
0.79
bcc-csm1-1-m
-72.4
-6.9
17.0
0.2
access to
plots
0.82
0.76
0.81
0.93
0.56
0.77
BNU-ESM
-65.1
0.6
16.8
0.1
access to
plots
0.84
0.76
0.78
0.92
0.60
0.78
CanESM2
-74.0
-8.4
20.1
0.3
access to
plots
0.78
0.72
0.79
0.90
0.54
0.74
CESM1-BGC
-71.1
-5.5
16.6
-0.0
access to
plots
0.82
0.76
0.81
0.92
0.62
0.78
GFDL-ESM2G
-70.0
-4.3
18.5
0.0
access to
plots
0.82
0.74
0.77
0.91
0.54
0.75
HadGEM2-ES
-75.4
-9.9
17.4
0.4
access to
plots
0.80
0.75
0.80
0.92
0.58
0.77
inmcm4
-58.5
7.1
17.3
0.5
access to
plots
0.82
0.76
0.78
0.92
0.60
0.77
IPSL-CM5A-LR
-83.9
-18.3
24.0
0.6
access to
plots
0.70
0.66
0.73
0.92
0.60
0.71
MIROC-ESM
-67.7
-2.0
17.7
0.1
access to
plots
0.81
0.75
0.77
0.86
0.58
0.75
MPI-ESM-LR
-65.7
-0.0
15.8
0.1
access to
plots
0.84
0.78
0.77
0.92
0.60
0.78
MRI-ESM1
-73.8
-8.3
18.6
0.1
access to
plots
0.79
0.74
0.80
0.91
0.60
0.76
NorESM1-ME
-69.4
-3.8
17.5
0.1
access to
plots
0.81
0.75
0.79
0.90
0.60
0.77
Notes: In calculating overall score, rmse score contributes double in comparison with all other scores.