| |
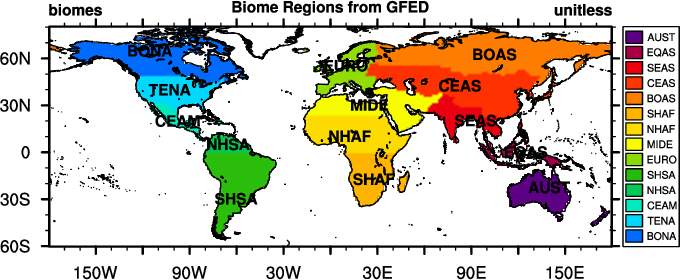
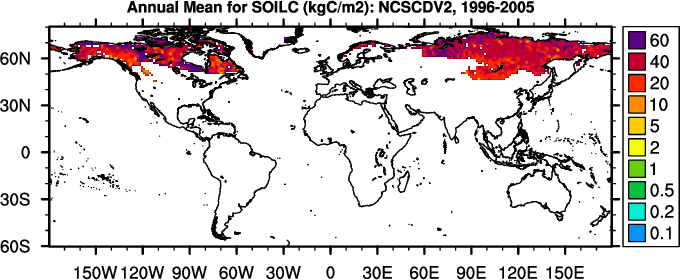
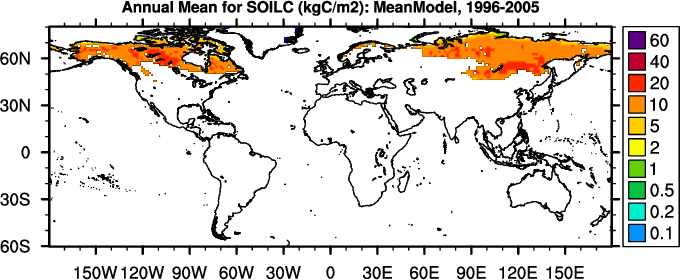
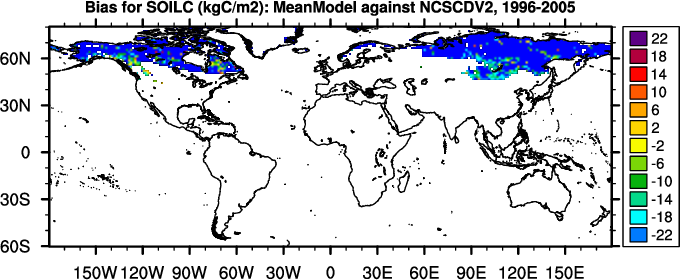
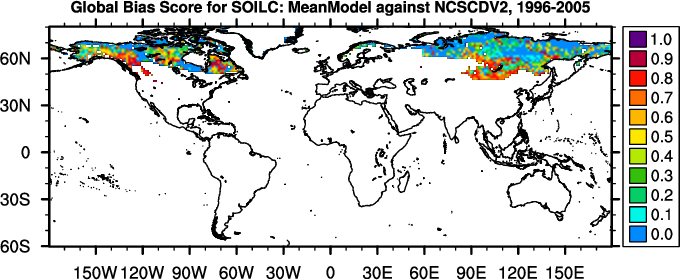
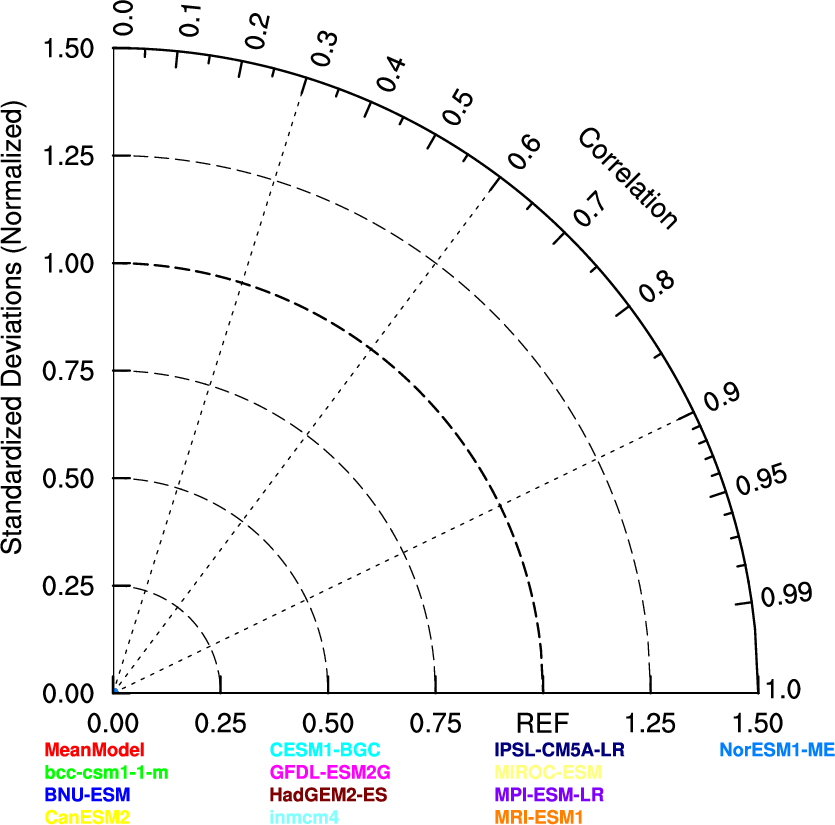
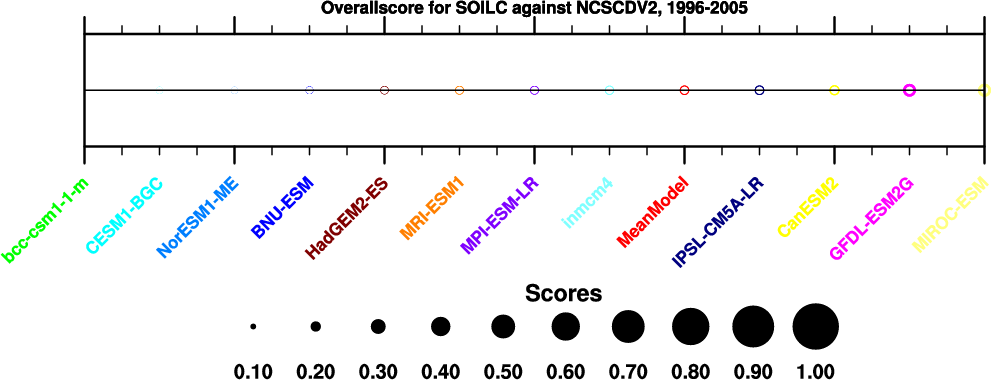
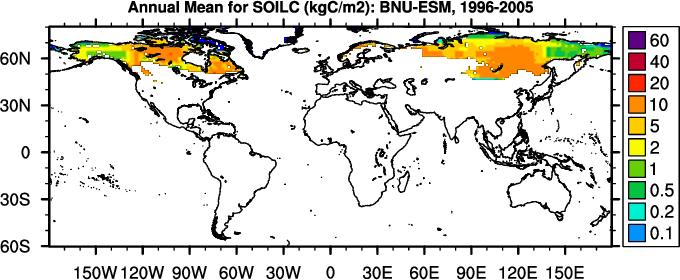
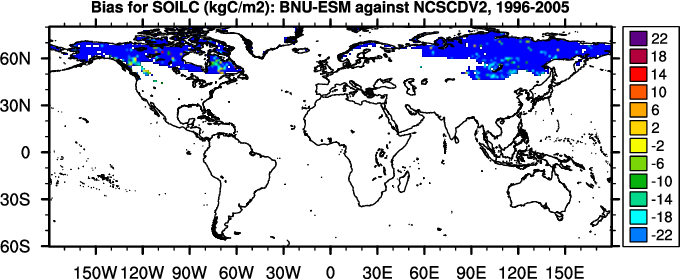
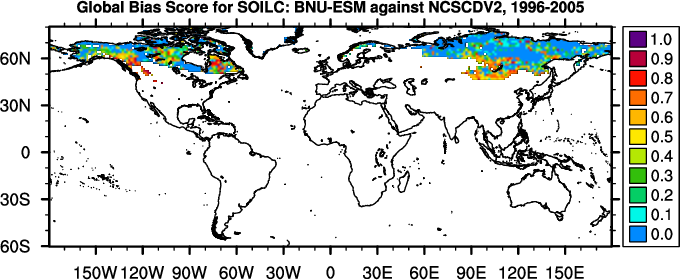
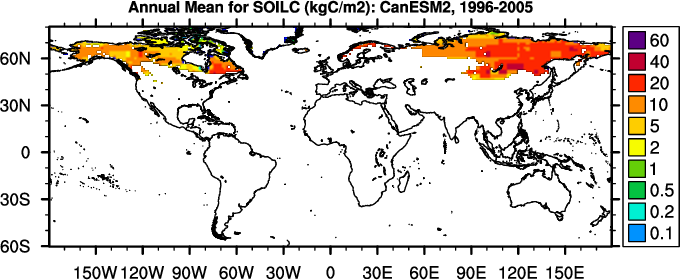
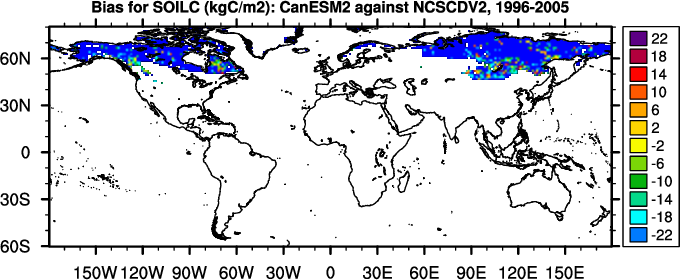
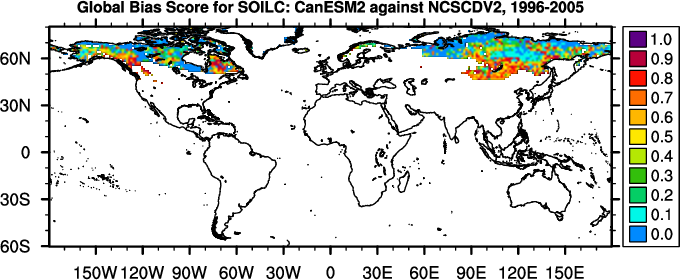
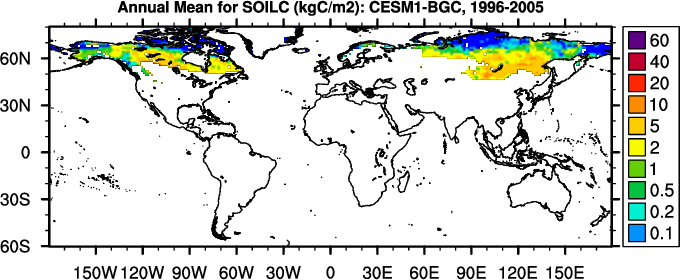
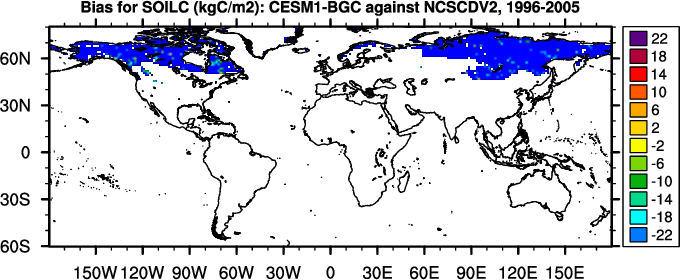
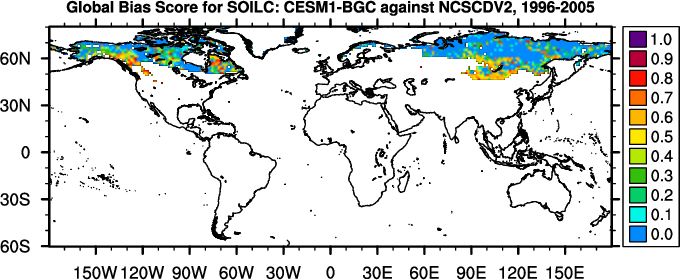
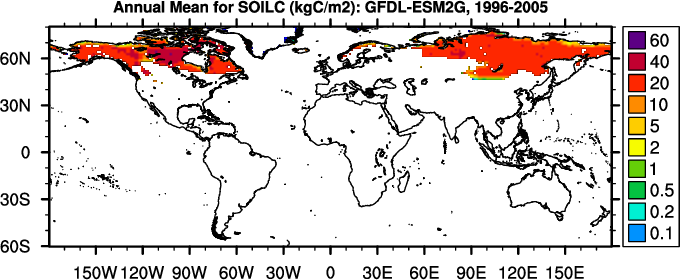
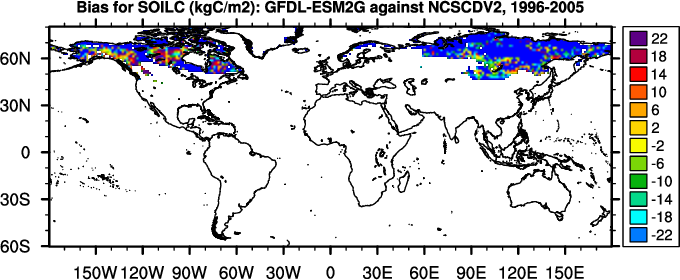
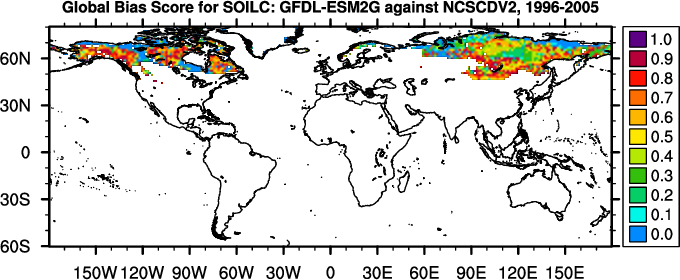
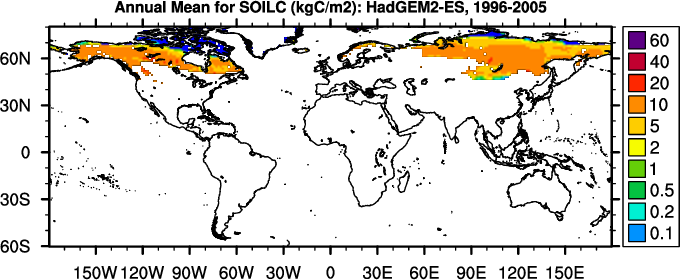
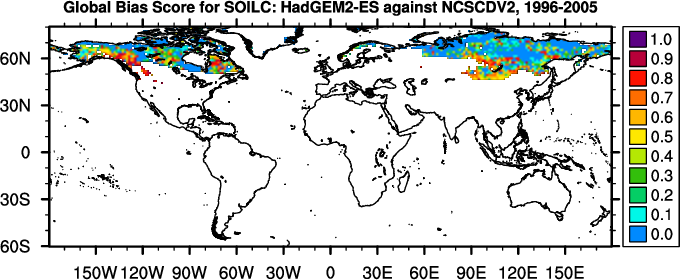
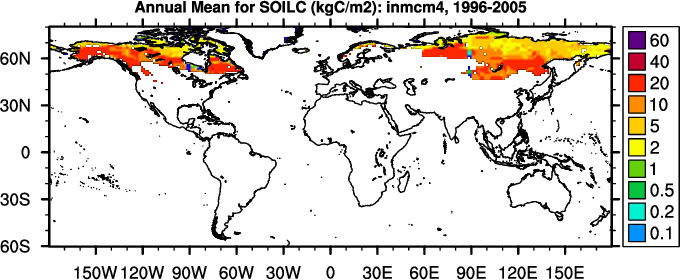
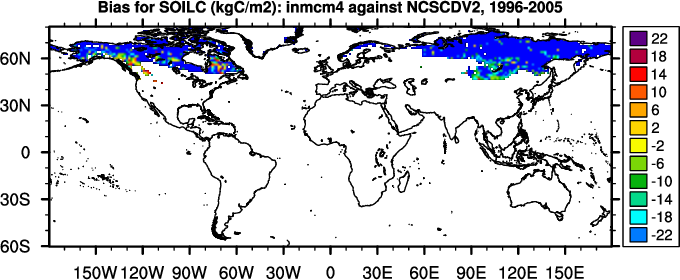
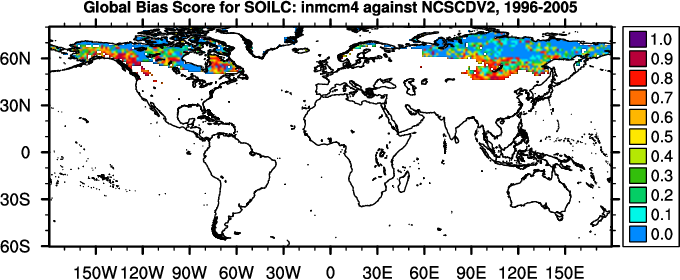
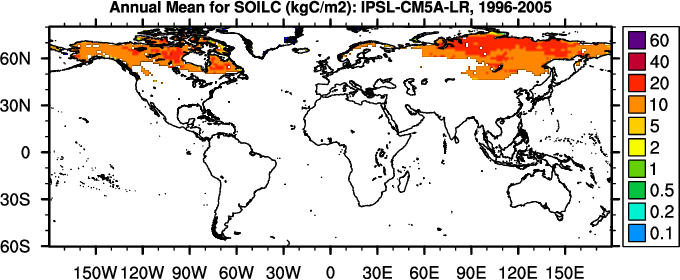
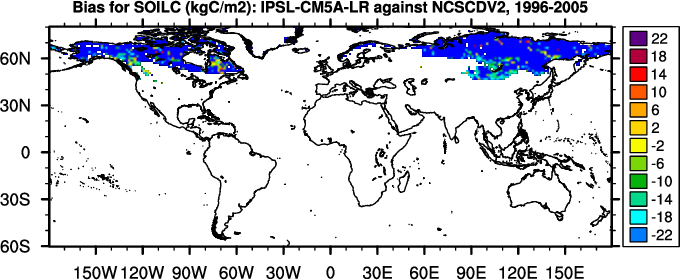
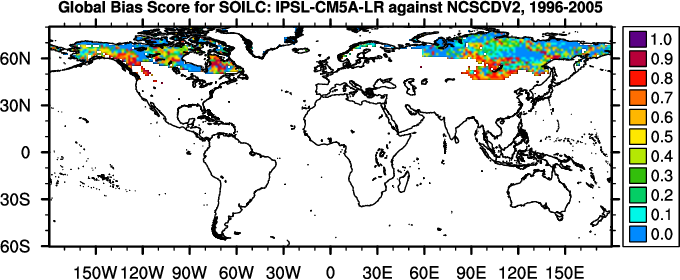
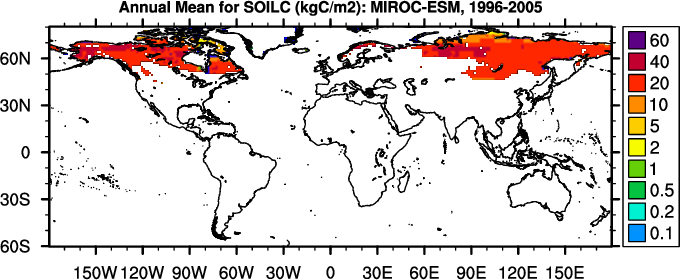
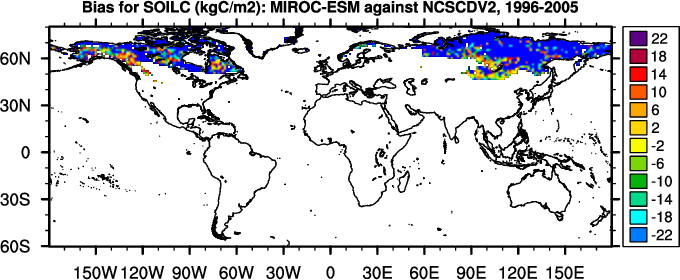
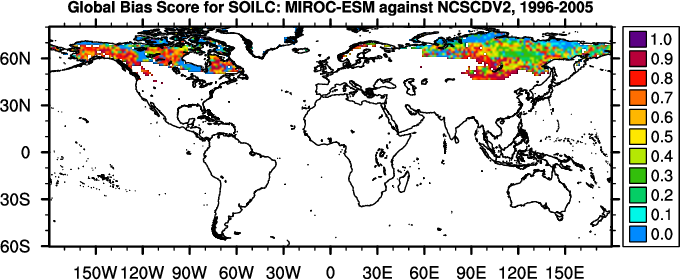
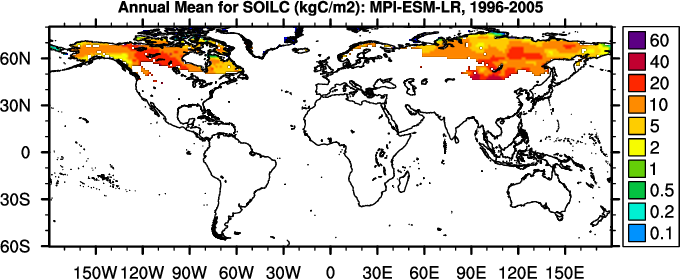
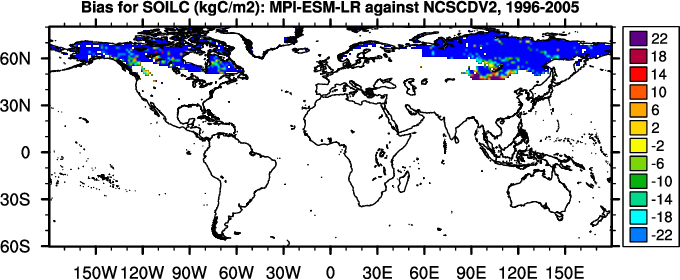
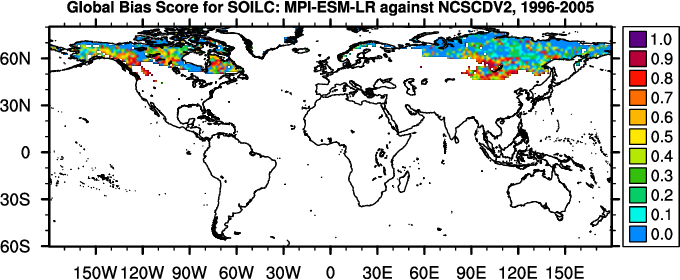
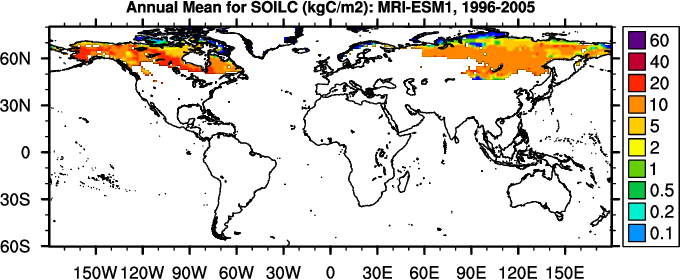
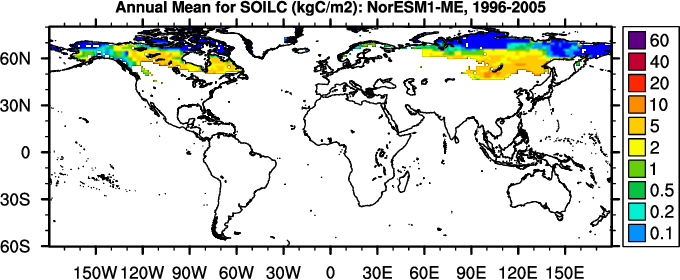
Diagnostic Summary for Soil Carbon: Model vs. NCSCDV2 |
|
|
|
|
||||||||||||||
|
|
|
||||||||||||||
|
|
|
|
|||||||||||||
|
|
|
|
|||||||||||||
|
|
|
|
|||||||||||||
|
|
|
|
|||||||||||||
|
|
|
|
|||||||||||||
|
|
|
|
|||||||||||||
|
|
|
|
|||||||||||||
|
|
|
|
|||||||||||||
|
|
|
|
|||||||||||||
|
|
|
|
|||||||||||||
|
|
|
|
|||||||||||||
|
|
|
|
|||||||||||||
|
|
|
|
|||||||||||||
|
|
|
|
| Notes: In calculating overall score, rmse score contributes double in comparison with all other scores. |