Output for ILAMB Diagnostics
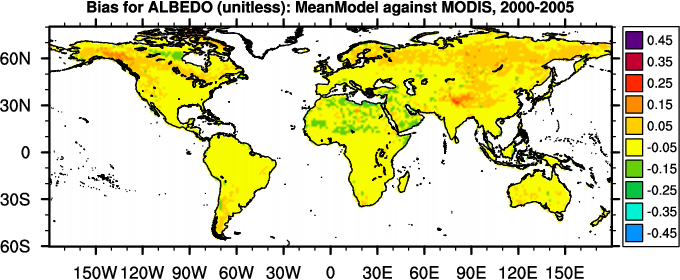
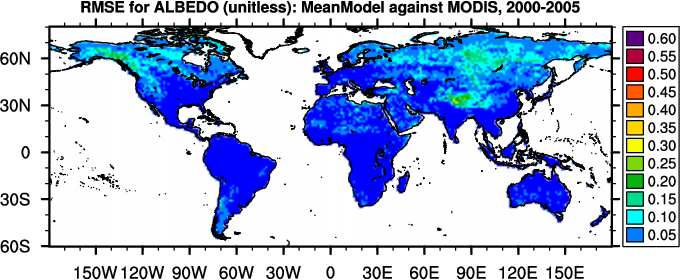
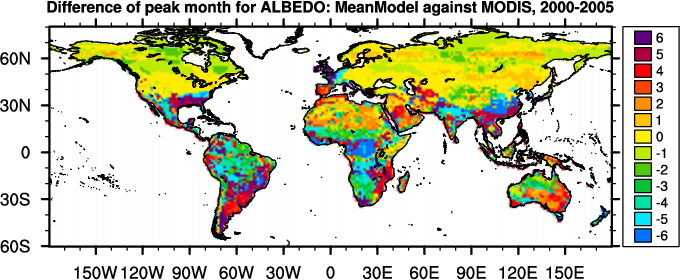
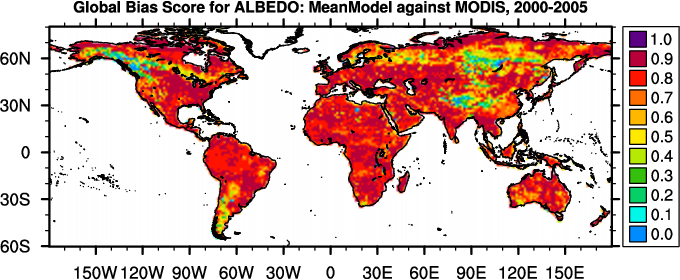
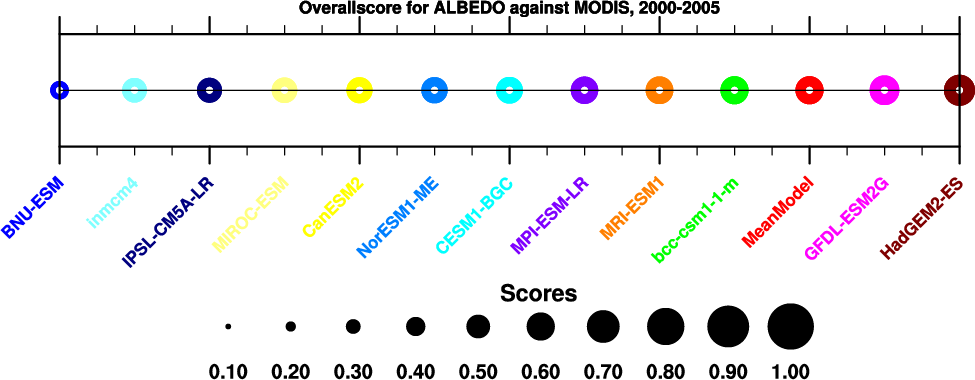
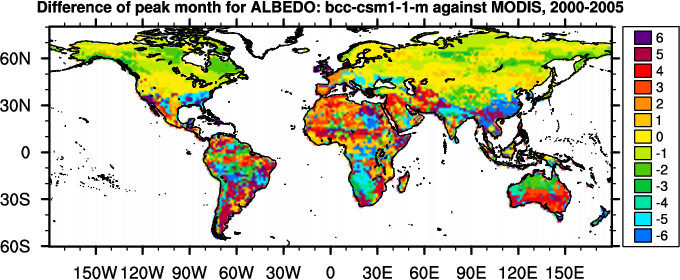
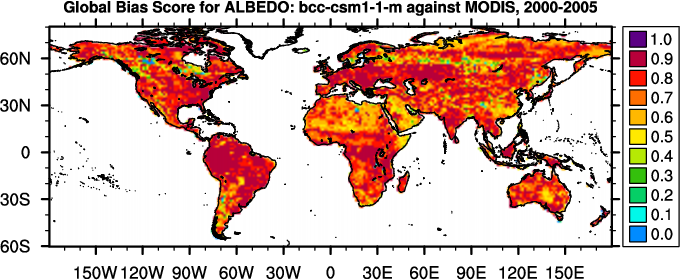
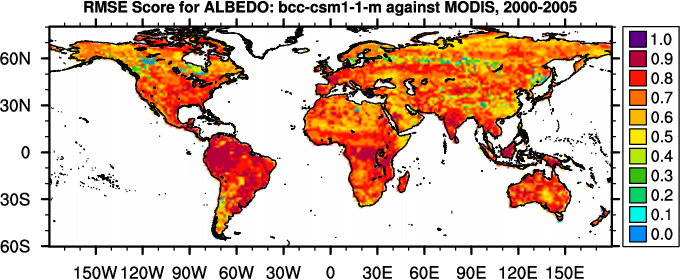
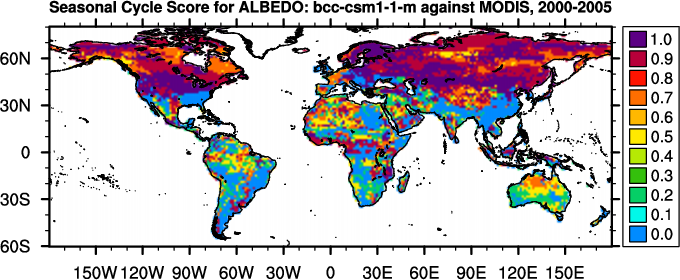
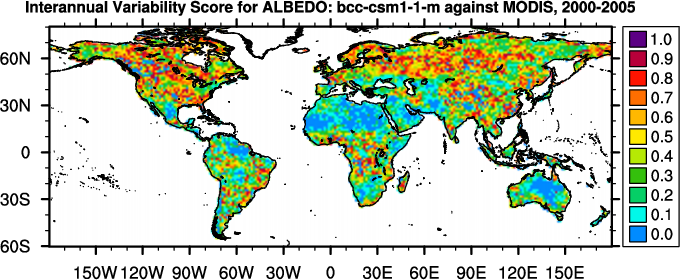
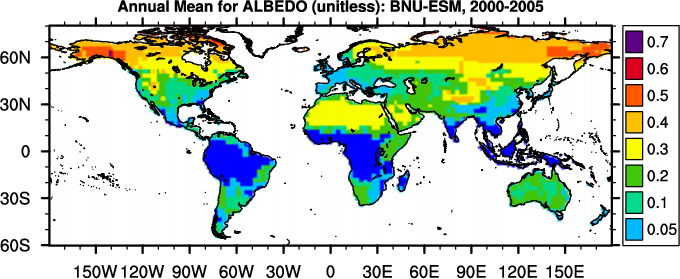
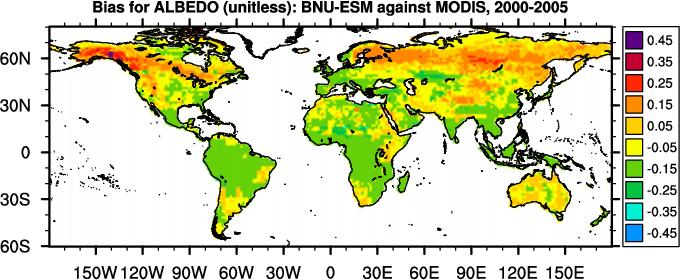
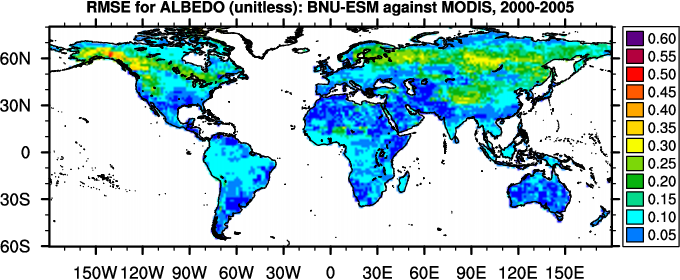
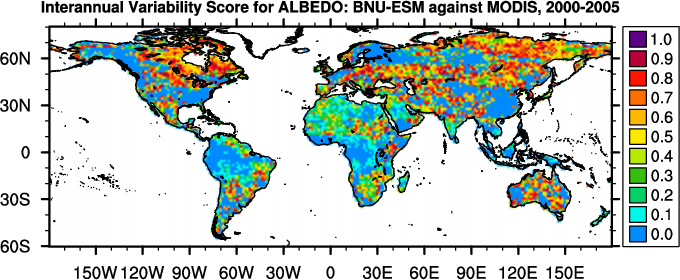
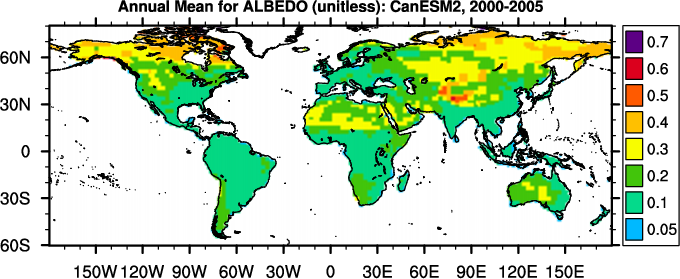
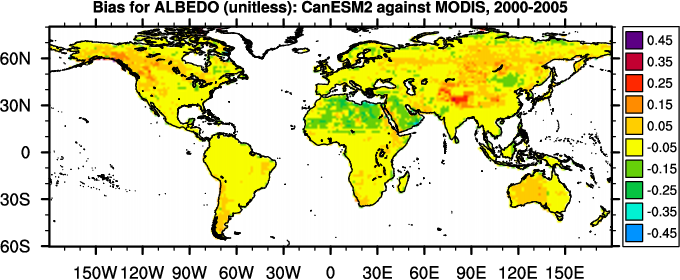
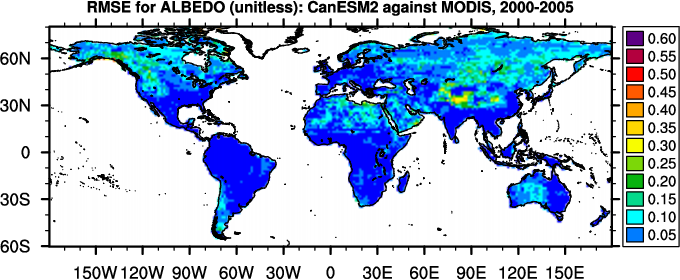
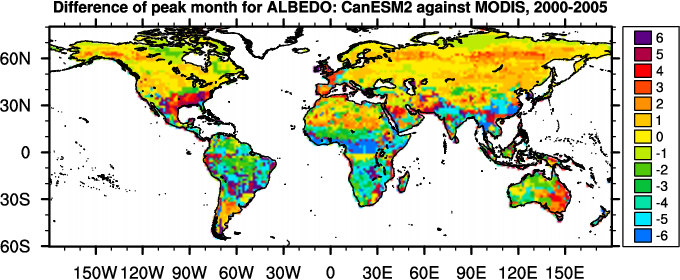
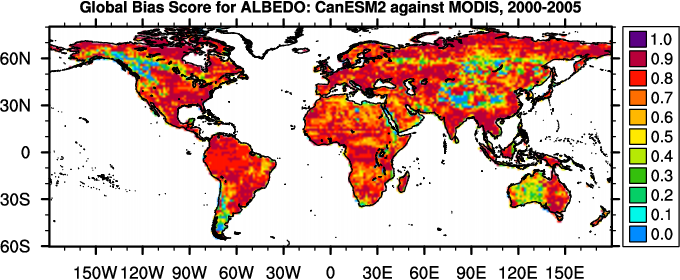
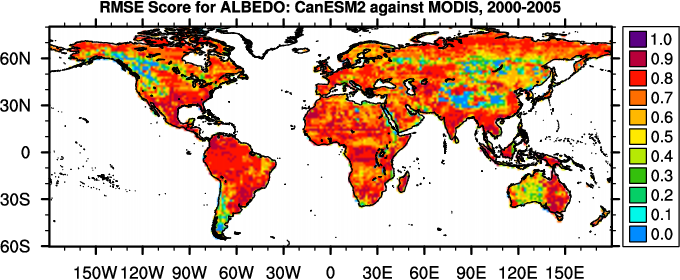
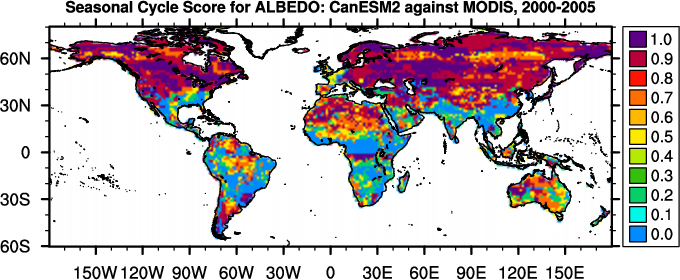
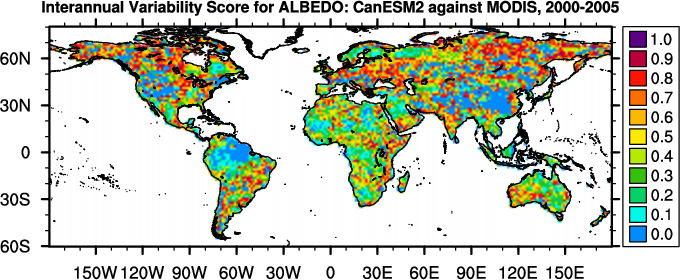
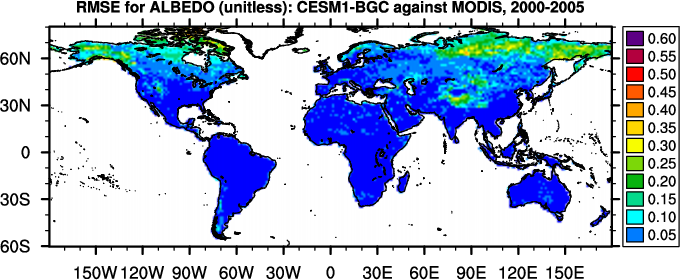
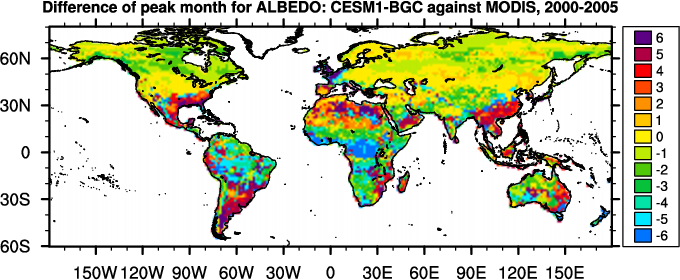
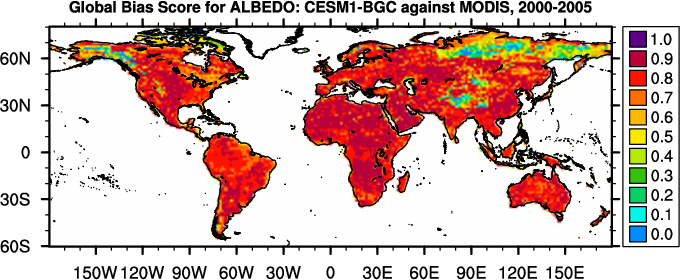
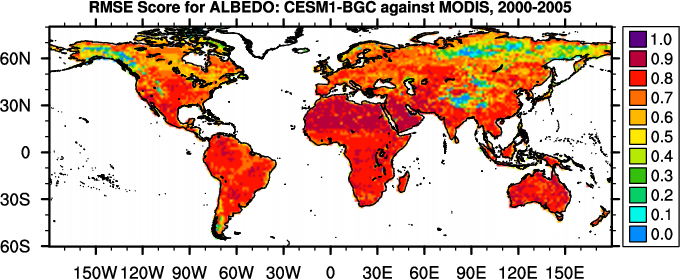
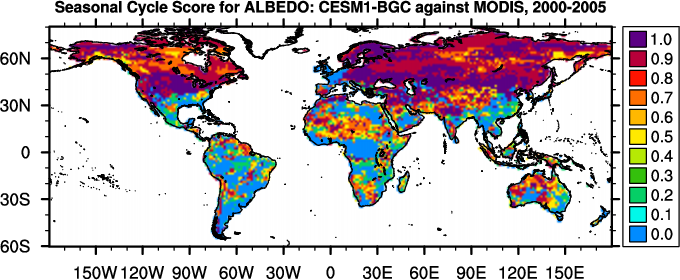
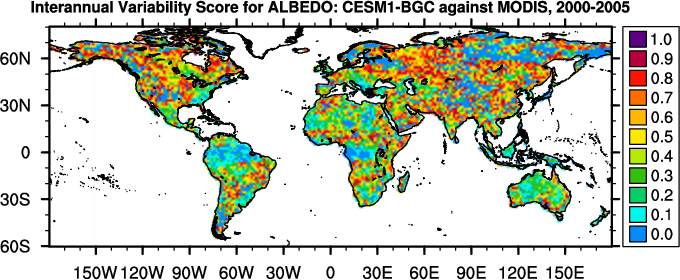
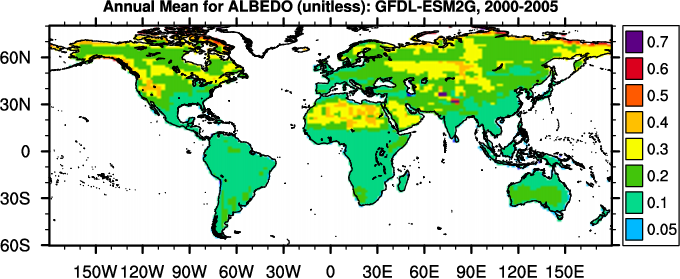
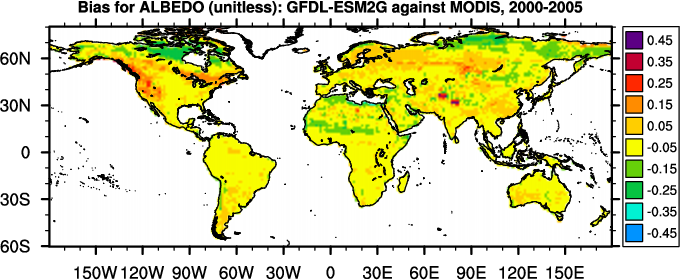
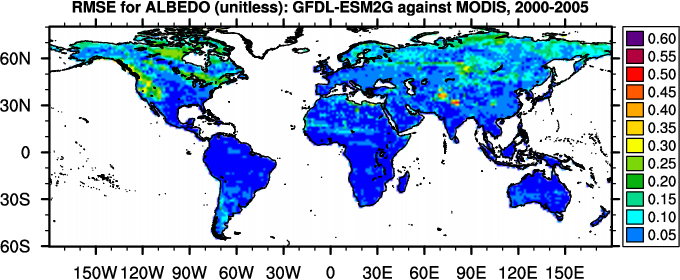
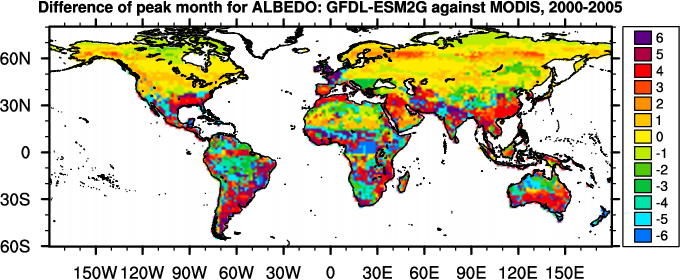
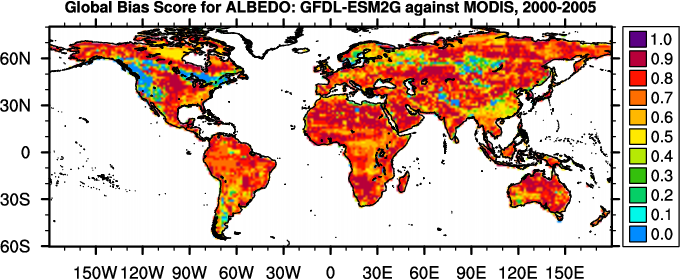
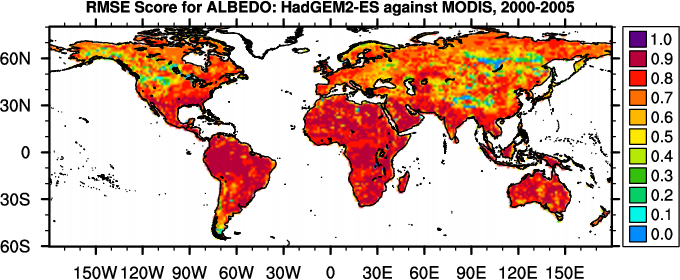
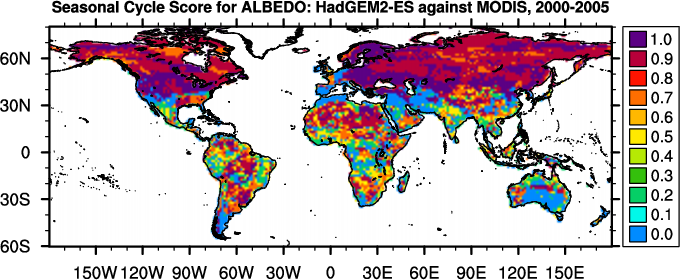
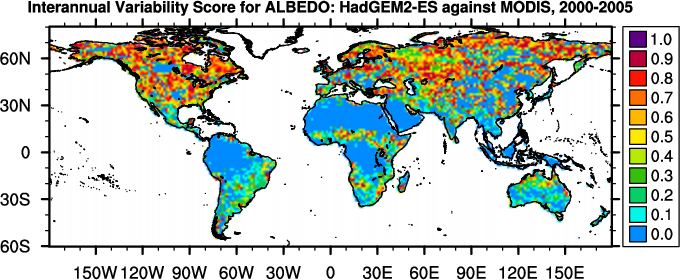
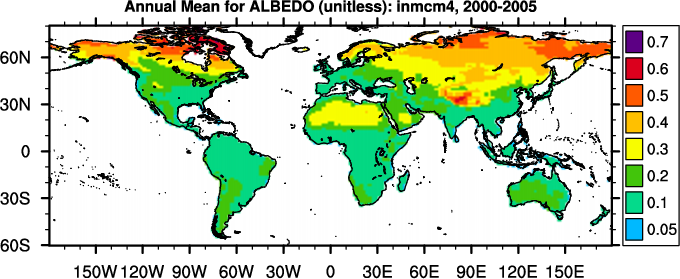
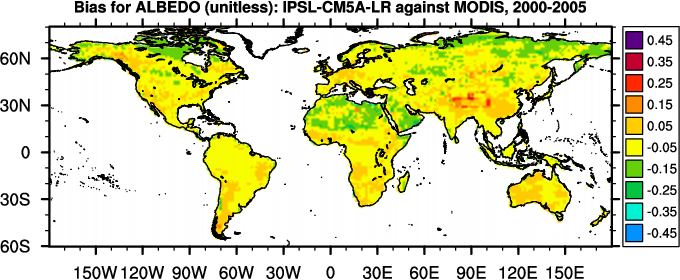
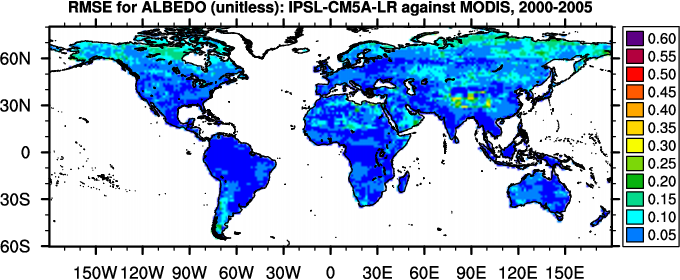
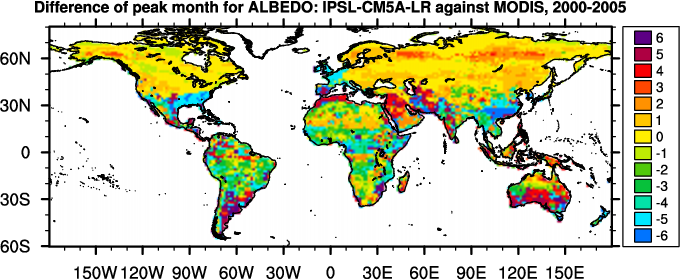
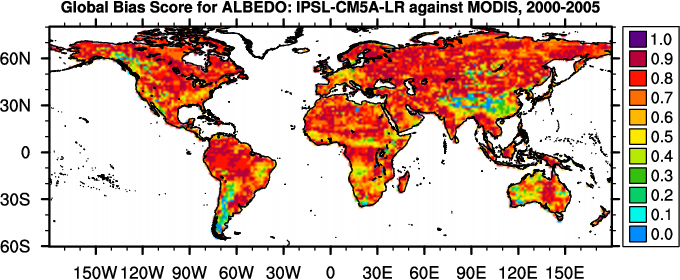
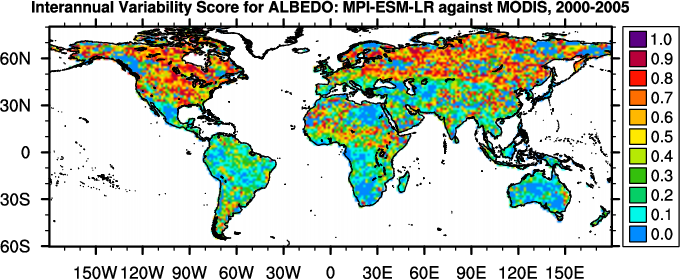
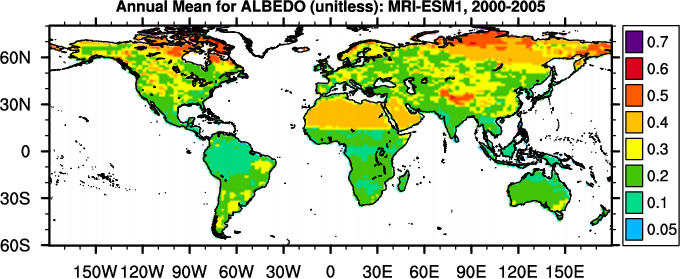
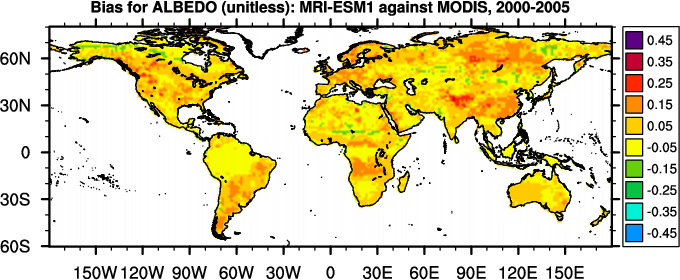
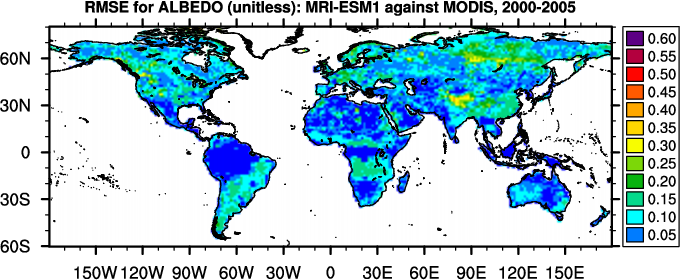
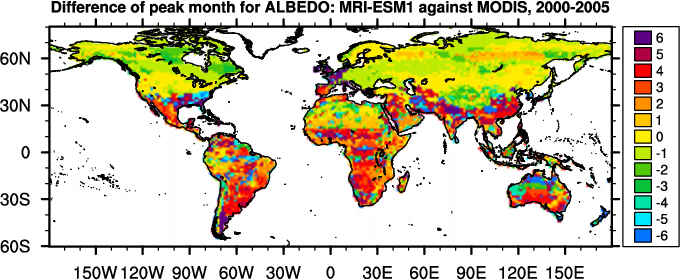
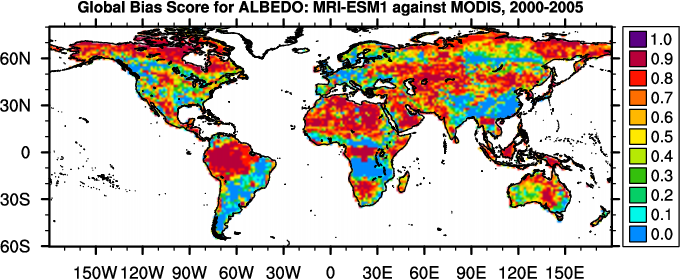
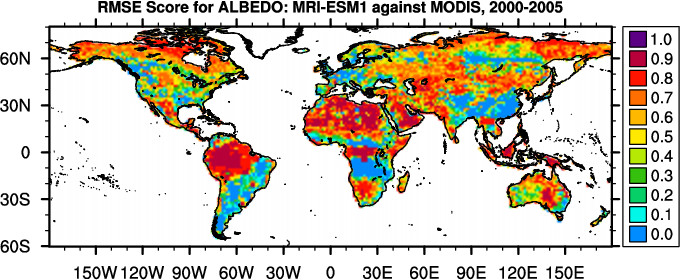
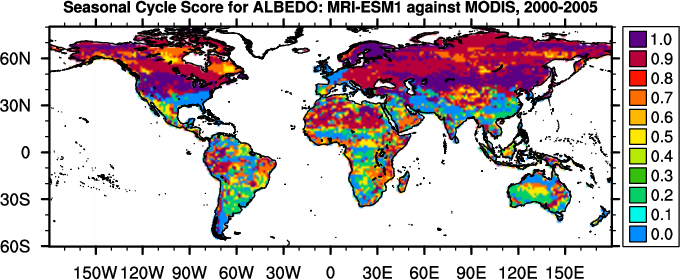
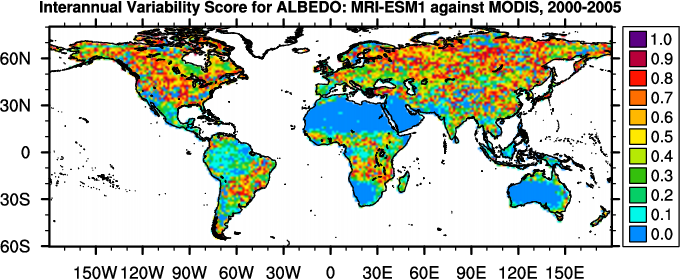
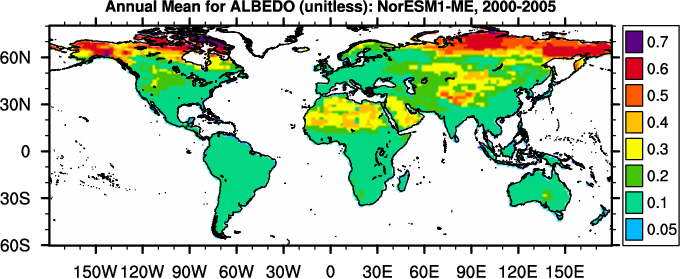
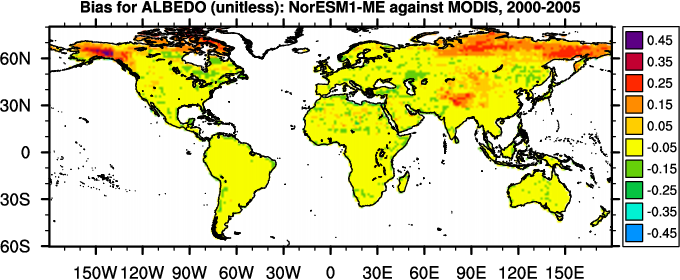
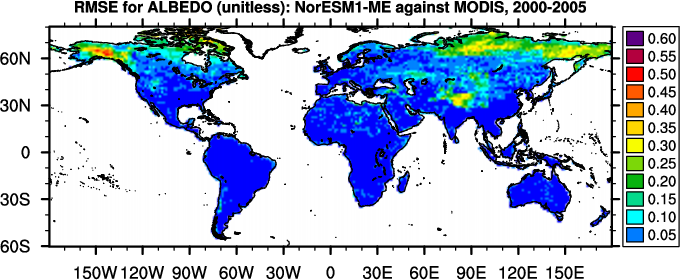
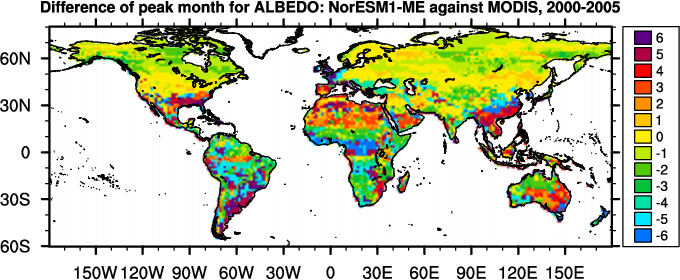
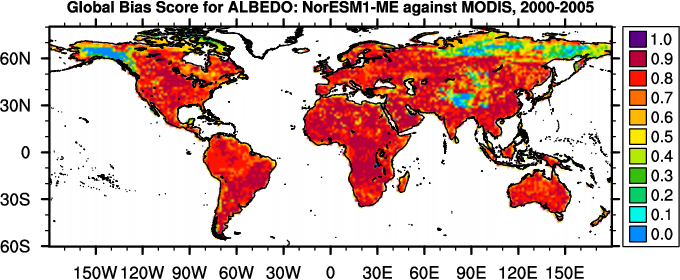
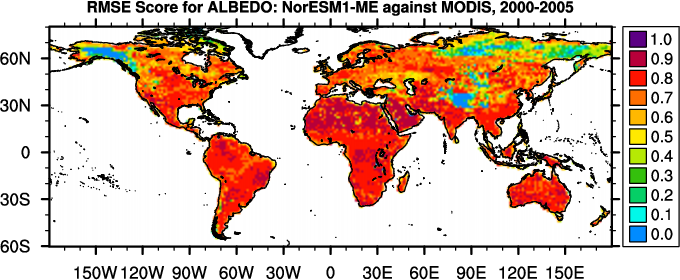
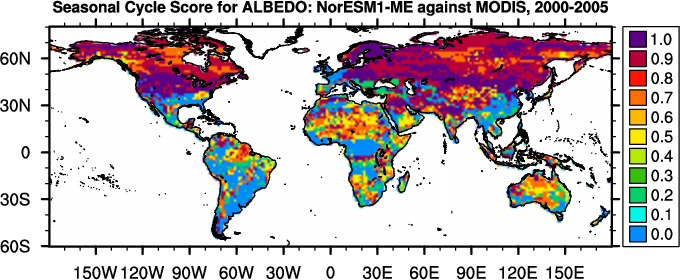
Diagnostic Summary for Albedo: Model vs. MODIS
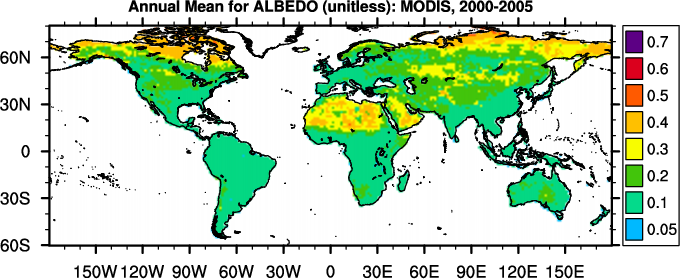
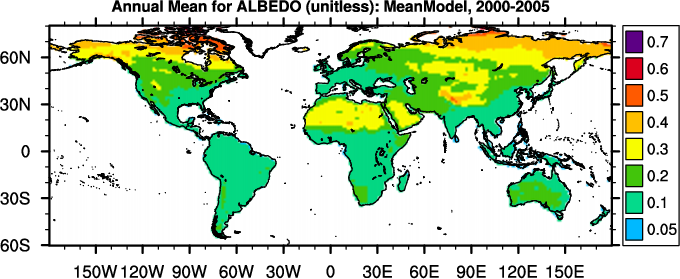
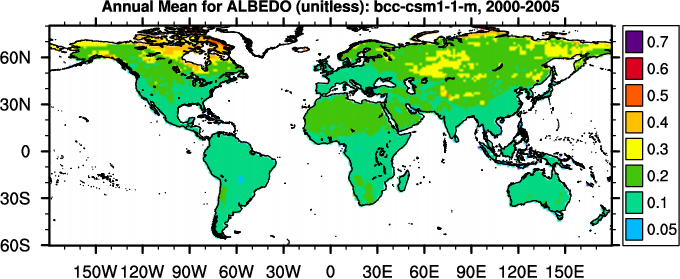
Global Patterns
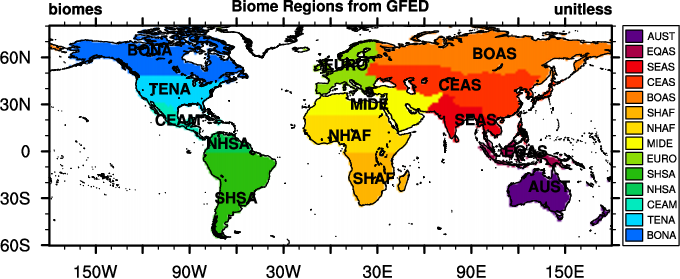
Regional Patterns
Scoring
(
Info
)
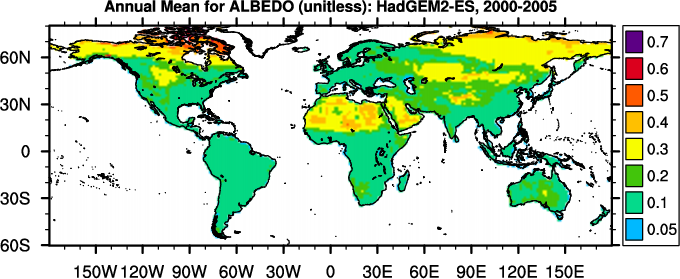
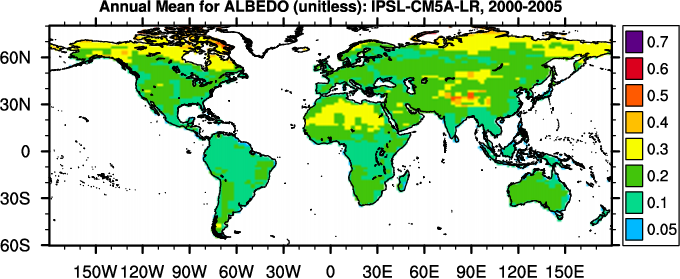
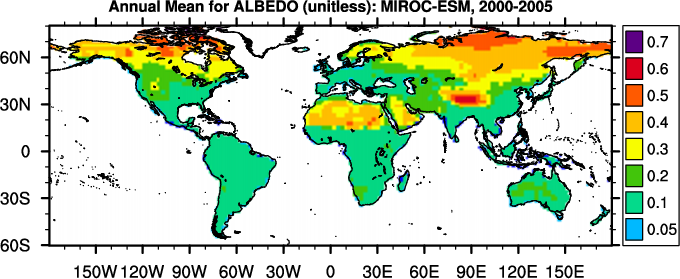
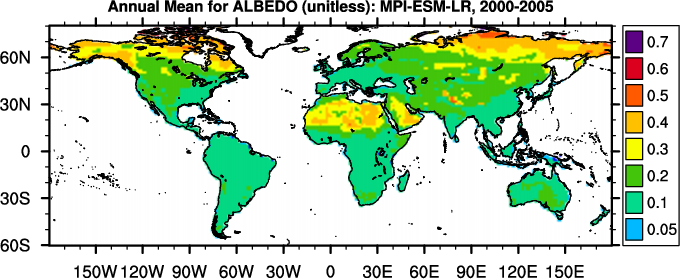
Annual Mean (unitless)
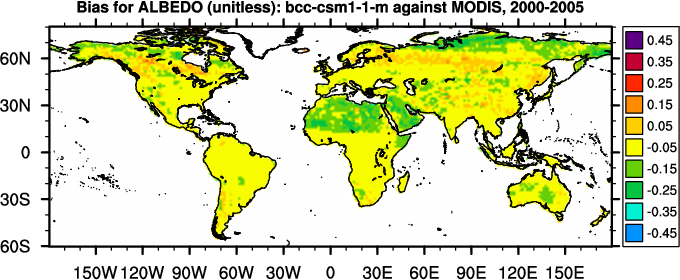
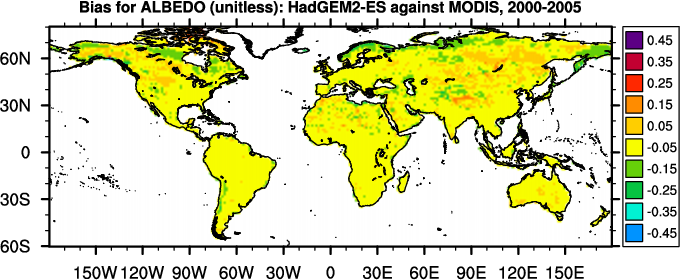
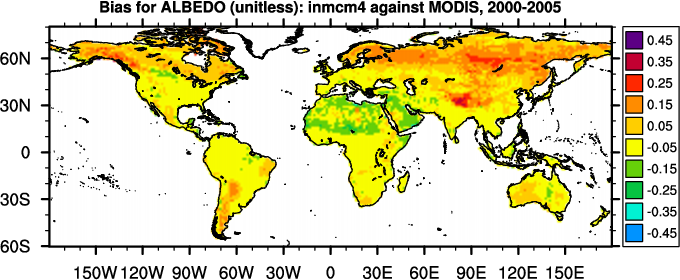
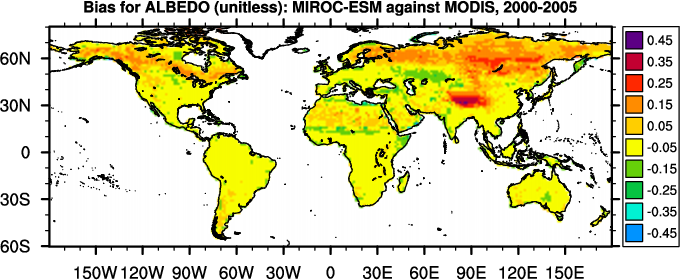
Bias (unitless)
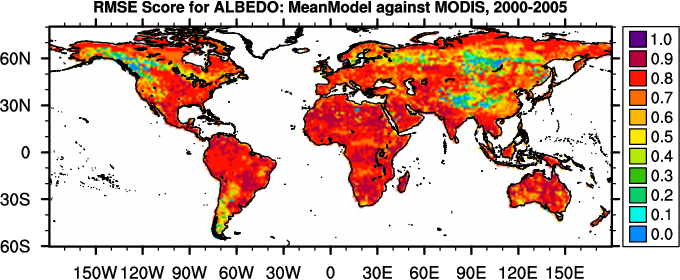
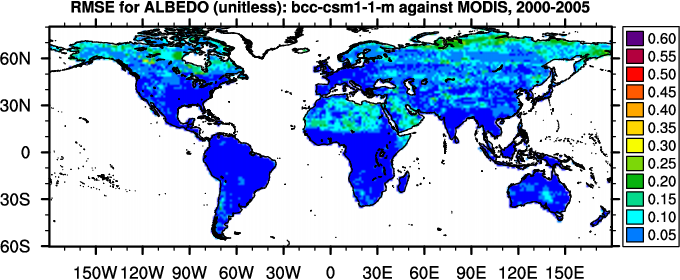
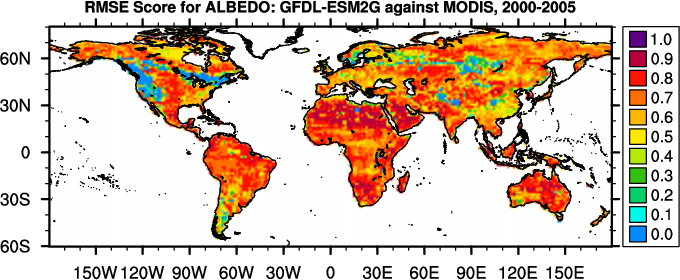
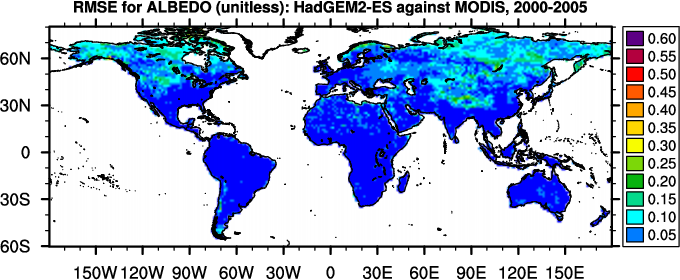
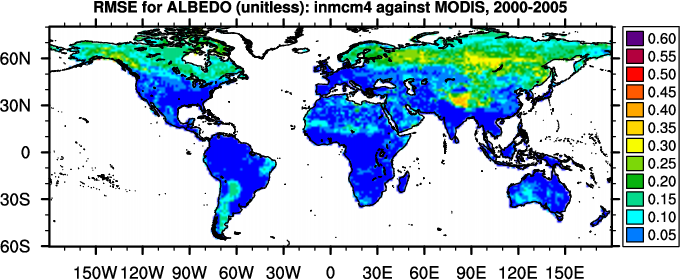
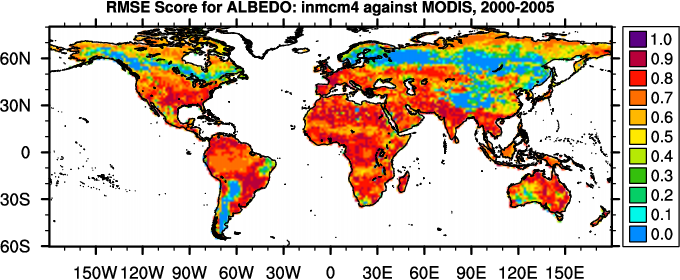
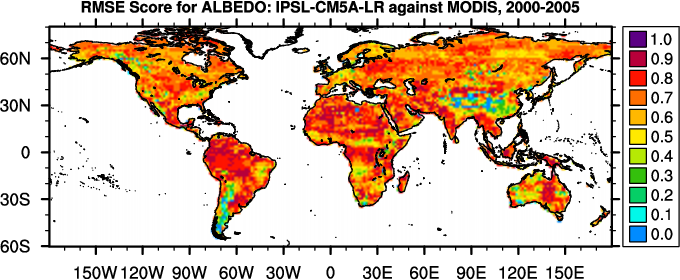
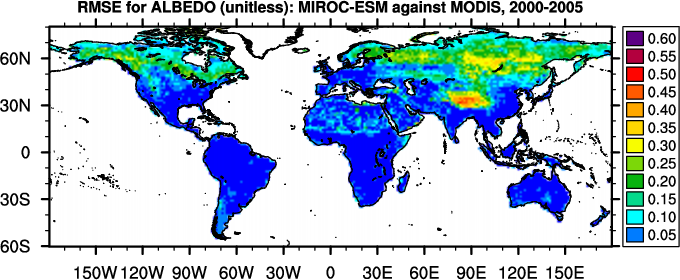
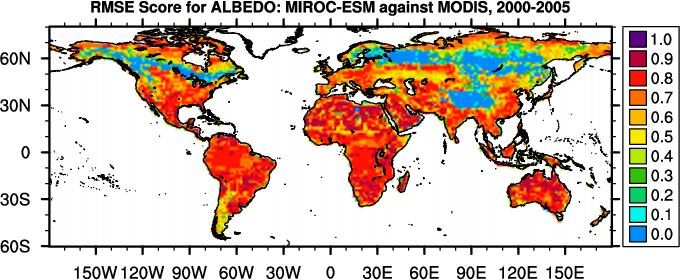
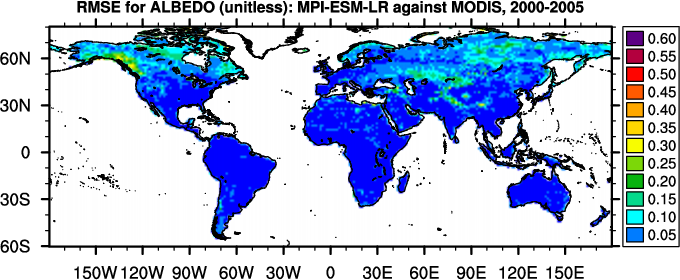
RMSE (unitless)
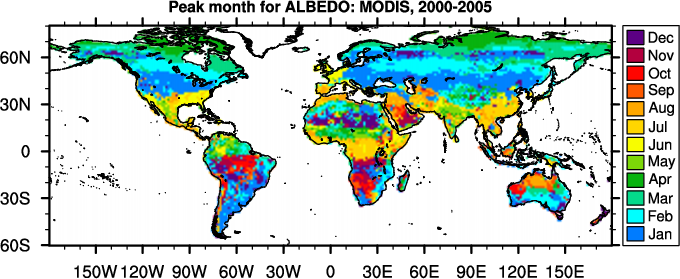
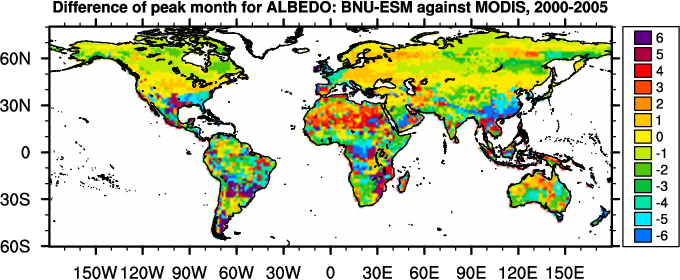
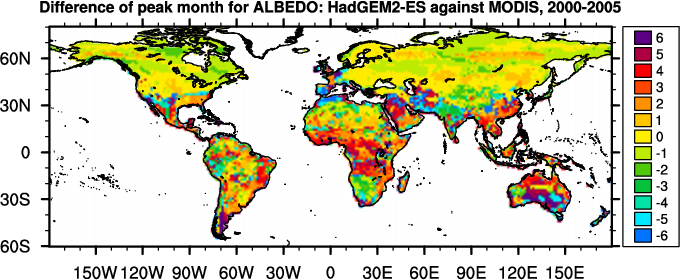
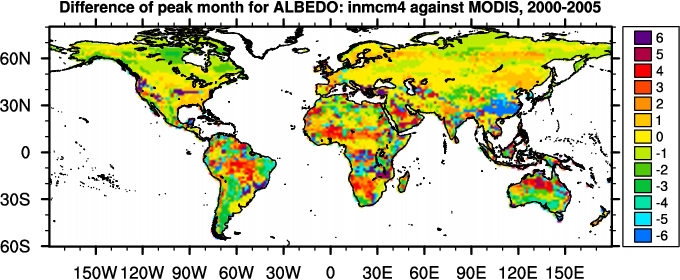
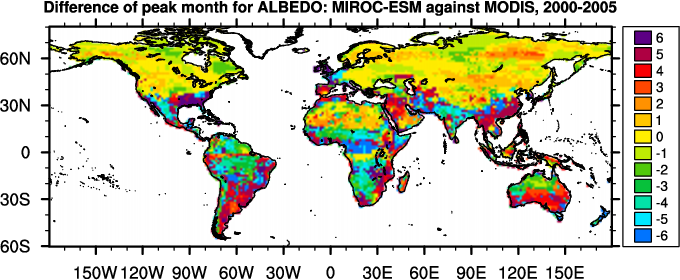
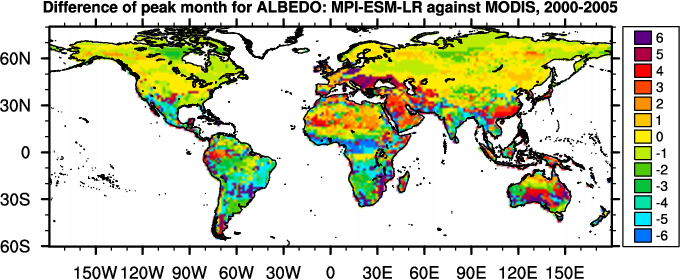
Phase Change (months)
GFED
Regions
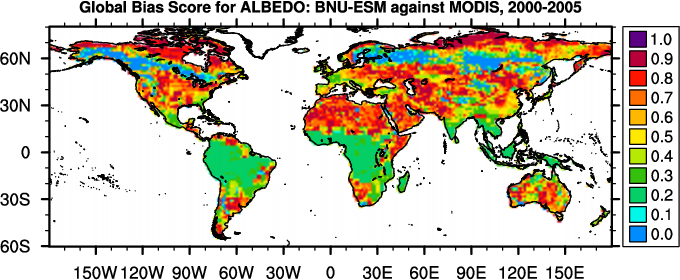
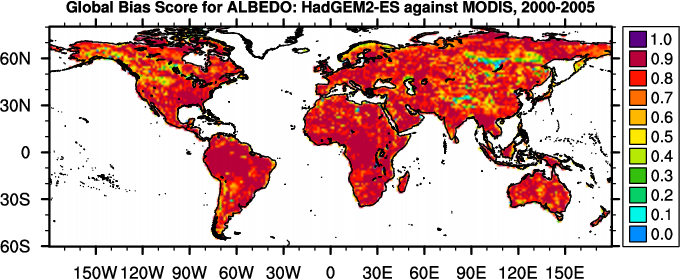
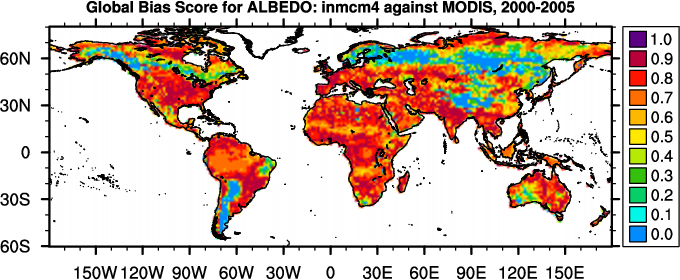
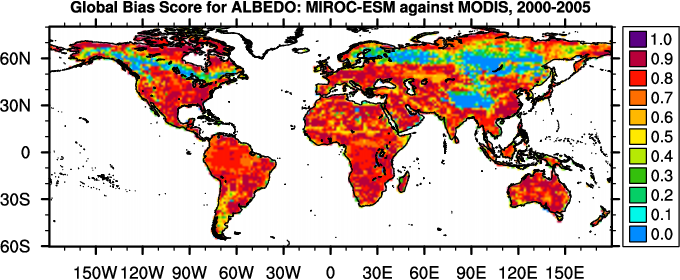
Global Bias
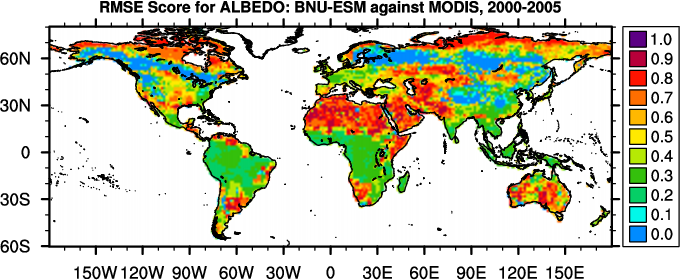
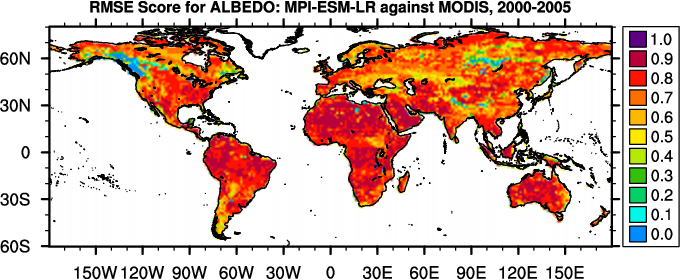
RMSE
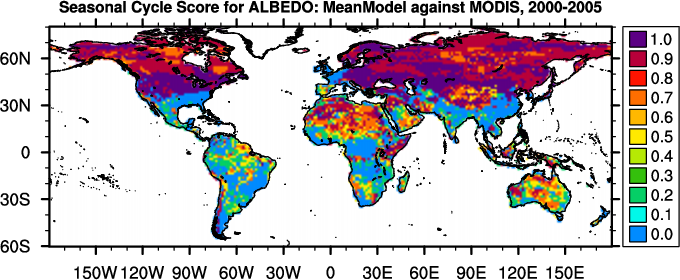
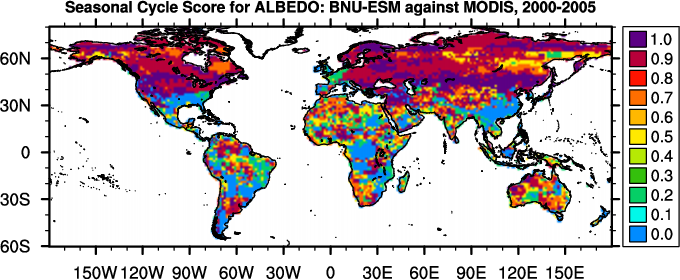
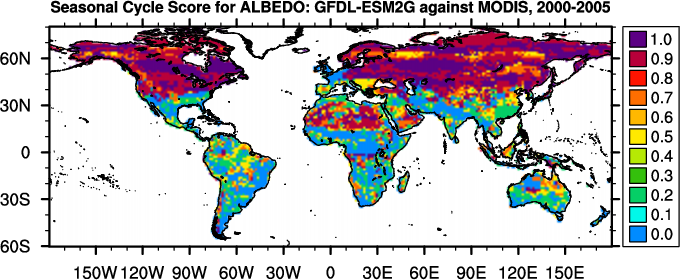
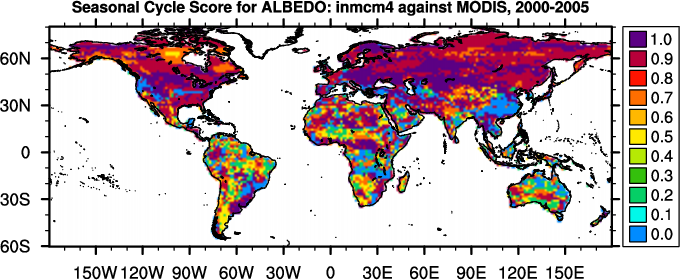
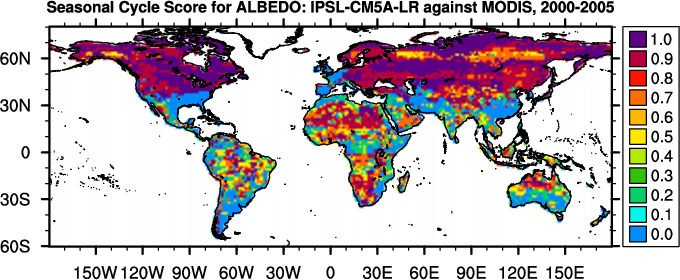
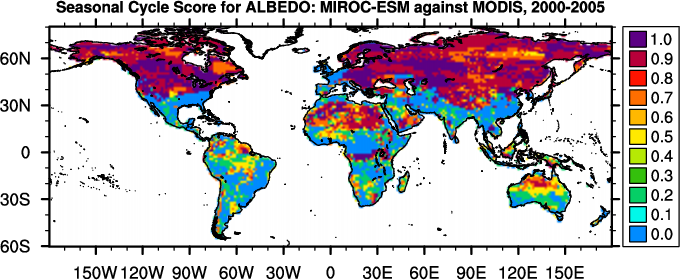
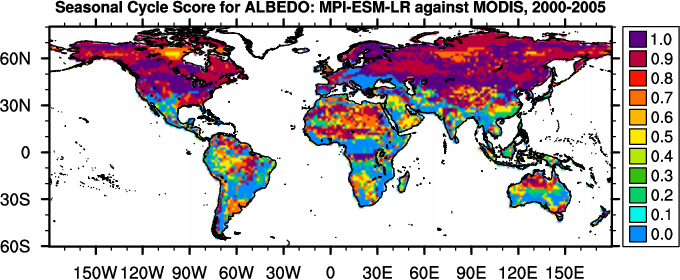
Seasonal Cycle
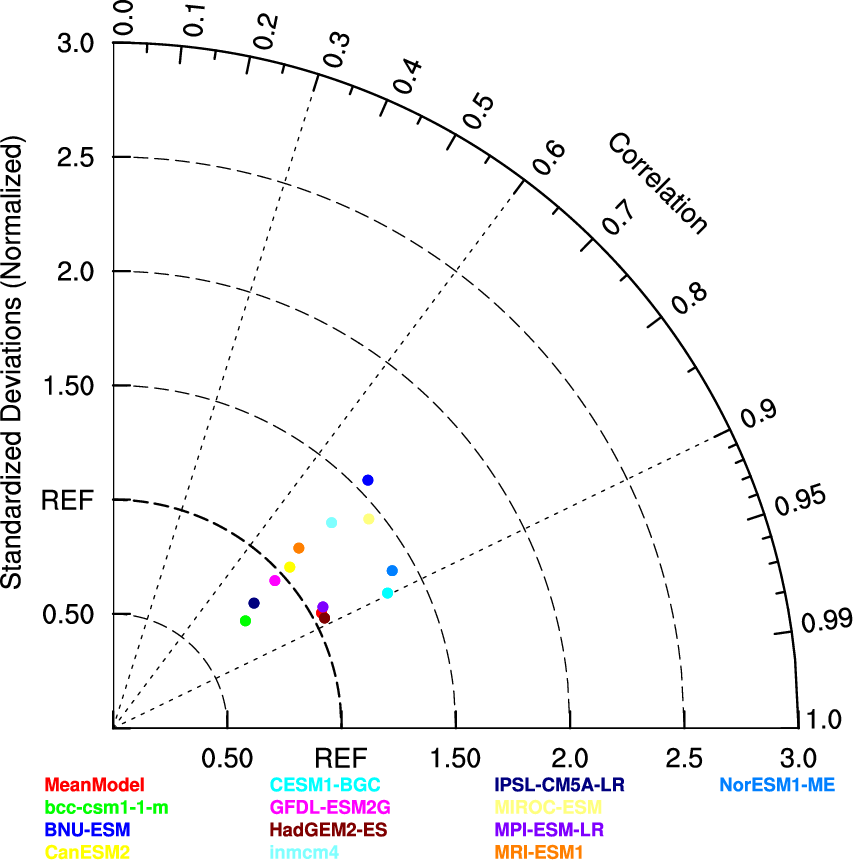
Spatial Distribution
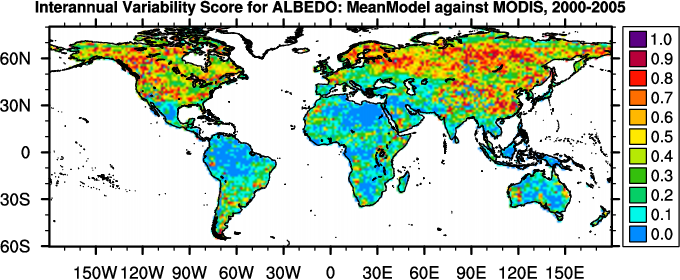
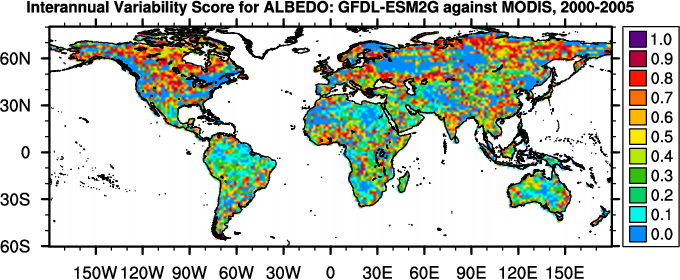
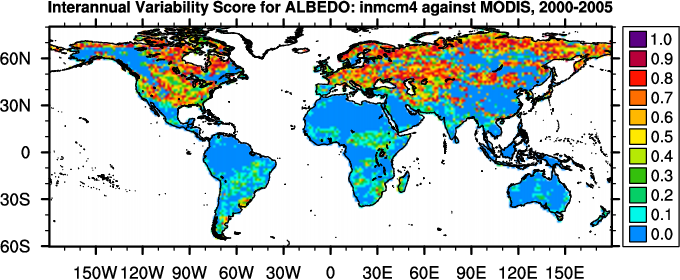
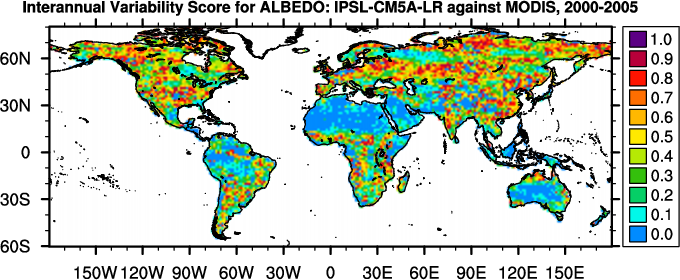
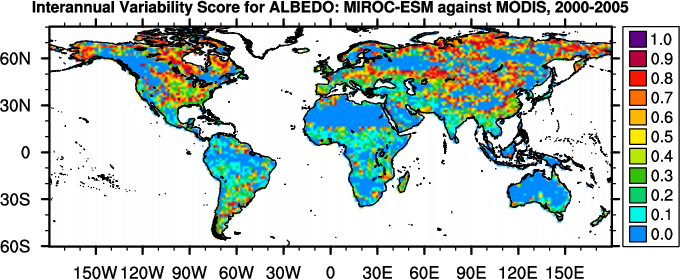
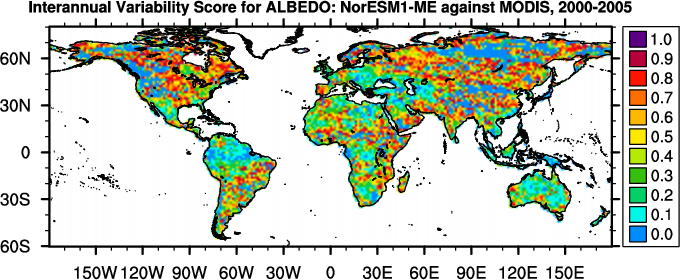
Interannual Variability
Overall
Benchmark
[Schaaf et al. (2011)]
0.22
-
-
0.00
access to
plots
-
-
-
-
-
-
MeanModel
0.23
0.02
0.05
-0.01
access to
plots
0.81
0.77
0.57
0.94
0.33
0.60
bcc-csm1-1-m
0.21
-0.01
0.06
0.09
access to
plots
0.81
0.75
0.56
0.82
0.40
0.60
BNU-ESM
0.21
-0.01
0.11
-0.51
access to
plots
0.56
0.49
0.62
0.71
0.33
0.38
CanESM2
0.23
0.02
0.07
-0.21
access to
plots
0.75
0.71
0.60
0.87
0.42
0.55
CESM1-BGC
0.22
0.00
0.06
-0.28
access to
plots
0.82
0.77
0.58
0.87
0.43
0.57
GFDL-ESM2G
0.23
0.02
0.07
0.51
access to
plots
0.74
0.69
0.54
0.87
0.39
0.63
HadGEM2-ES
0.22
0.00
0.05
0.36
access to
plots
0.84
0.78
0.63
0.94
0.31
0.66
inmcm4
0.26
0.04
0.09
-0.09
access to
plots
0.69
0.65
0.70
0.80
0.24
0.52
IPSL-CM5A-LR
0.23
0.01
0.07
-0.29
access to
plots
0.75
0.71
0.61
0.84
0.36
0.53
MIROC-ESM
0.24
0.03
0.09
0.15
access to
plots
0.71
0.66
0.54
0.78
0.28
0.54
MPI-ESM-LR
0.23
0.01
0.05
-0.19
access to
plots
0.81
0.77
0.61
0.93
0.37
0.58
MRI-ESM1
0.29
0.07
0.10
0.64
access to
plots
0.57
0.54
0.61
0.85
0.37
0.59
NorESM1-ME
0.22
0.01
0.06
-0.25
access to
plots
0.80
0.75
0.59
0.84
0.41
0.56
Notes: In calculating overall score, rmse score contributes double in comparison with all other scores.