Output for ILAMB Diagnostics
Diagnostic Summary for Surface Downward LW Radiation: Model vs. GEWEX.SRB
Global Patterns
Regional Patterns
Scoring
(
Info
)
Annual Mean (W/m2)
Bias (W/m2)
RMSE (W/m2)
Phase Change (months)
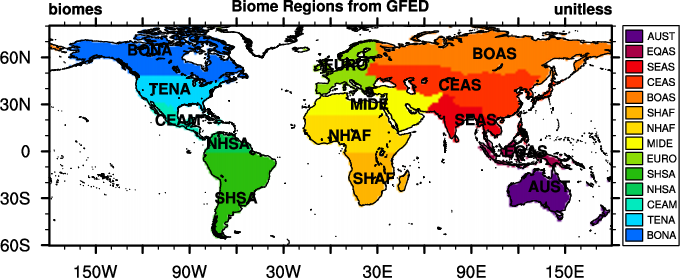
GFED
Regions
Global Bias
RMSE
Seasonal Cycle
Spatial Distribution
Interannual Variability
Overall
Benchmark
[Stackhouse et al. (2011)]
328.1
-
-
1.0
access to
plots
-
-
-
-
-
1.00
MeanModel
321.0
-7.1
12.7
0.3
access to
plots
0.97
0.96
0.93
0.99
0.54
0.81
bcc-csm1-1-m
326.7
-1.4
14.3
0.3
access to
plots
0.97
0.96
0.94
0.99
0.75
0.83
BNU-ESM
325.0
-3.1
15.4
0.4
access to
plots
0.97
0.95
0.93
0.99
0.63
0.83
CanESM2
321.4
-6.7
17.2
0.4
access to
plots
0.97
0.95
0.91
0.98
0.64
0.83
CESM1-BGC
322.2
-5.9
13.6
0.4
access to
plots
0.97
0.96
0.92
0.99
0.67
0.84
GFDL-ESM2G
322.8
-5.3
15.1
0.3
access to
plots
0.97
0.96
0.92
0.99
0.73
0.84
HadGEM2-ES
321.5
-6.6
13.4
0.2
access to
plots
0.97
0.96
0.94
0.99
0.77
0.83
inmcm4
320.8
-7.3
18.9
0.2
access to
plots
0.96
0.94
0.93
0.97
0.72
0.80
IPSL-CM5A-LR
304.2
-23.9
28.2
0.7
access to
plots
0.93
0.92
0.89
0.98
0.72
0.86
MIROC-ESM
324.5
-3.6
17.2
0.4
access to
plots
0.96
0.95
0.93
0.97
0.73
0.84
MPI-ESM-LR
327.9
-0.2
12.2
0.2
access to
plots
0.98
0.96
0.94
0.99
0.76
0.82
MRI-ESM1
316.1
-12.0
17.5
0.4
access to
plots
0.95
0.95
0.91
0.98
0.78
0.85
NorESM1-ME
319.3
-8.8
16.3
0.3
access to
plots
0.96
0.95
0.90
0.99
0.72
0.83
Notes: In calculating overall score, rmse score contributes double in comparison with all other scores.