Output for ILAMB Diagnostics
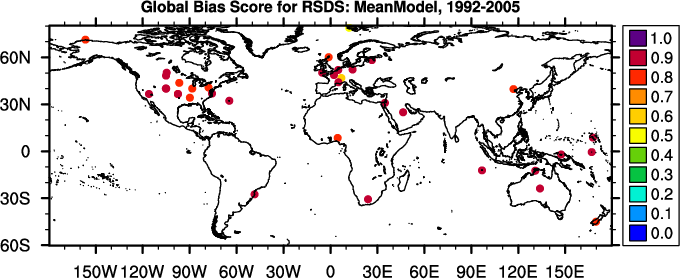
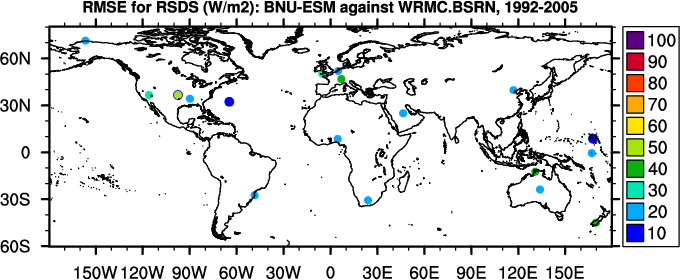
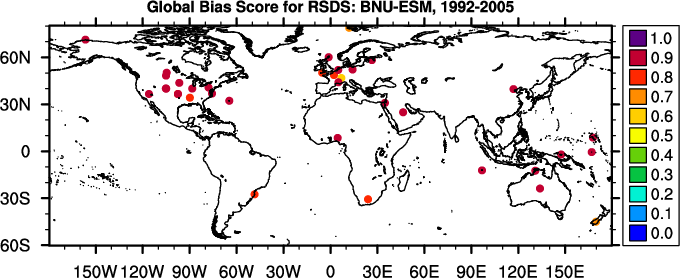
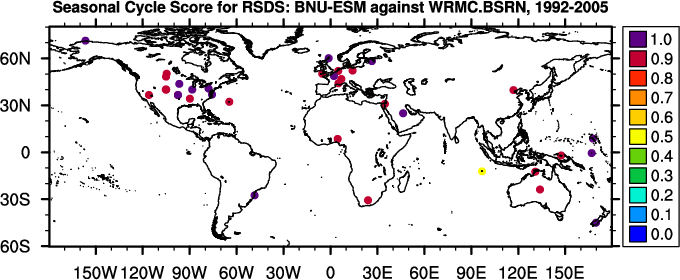
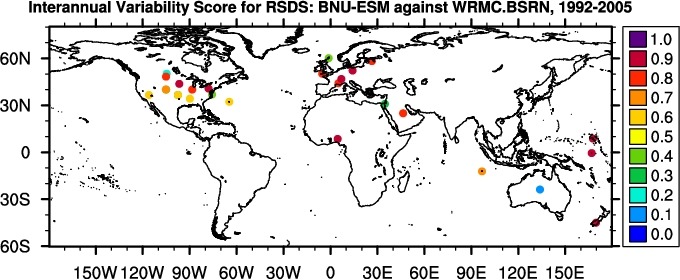
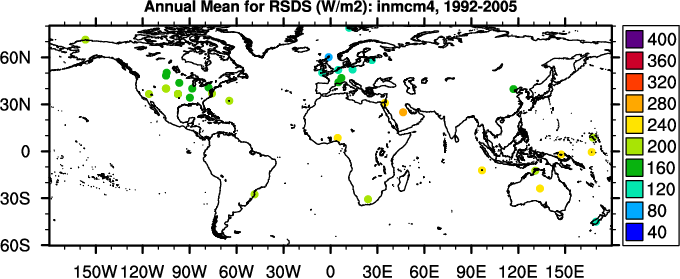
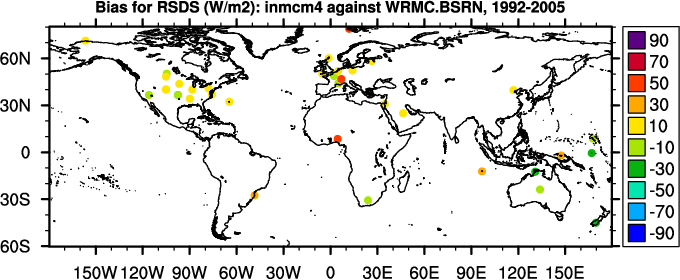
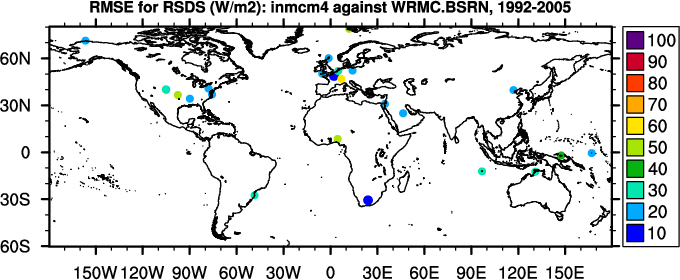
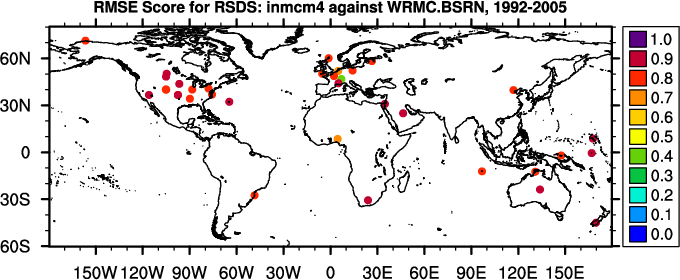
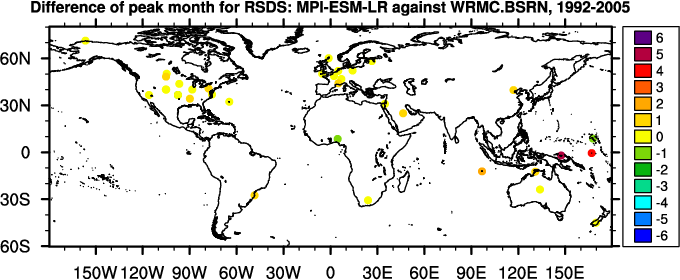
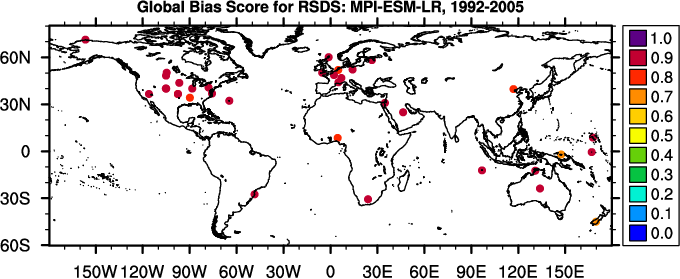
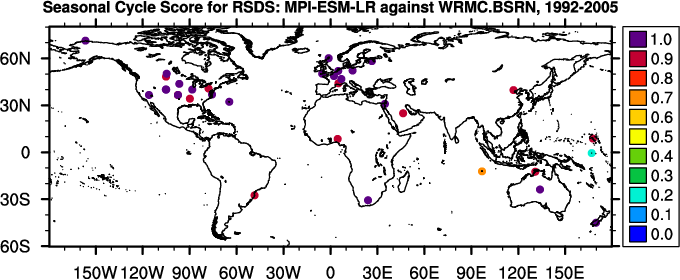
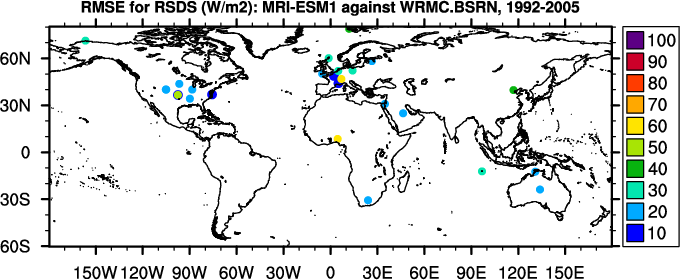
Diagnostic Summary for Surface Downward SW Radiation: Model vs. WRMC.BSRN
Global Patterns
Regional Patterns
Scoring
(
Info
)
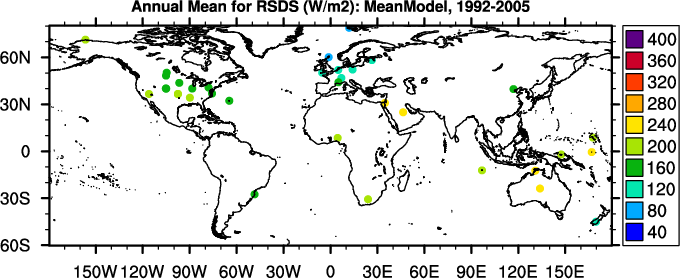
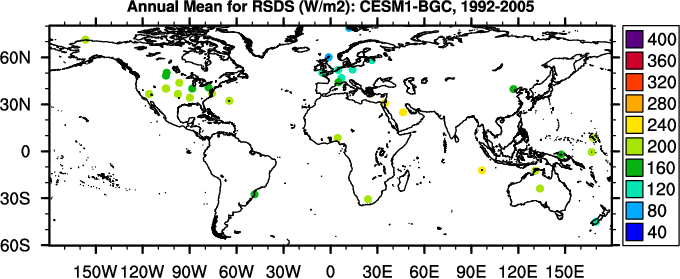
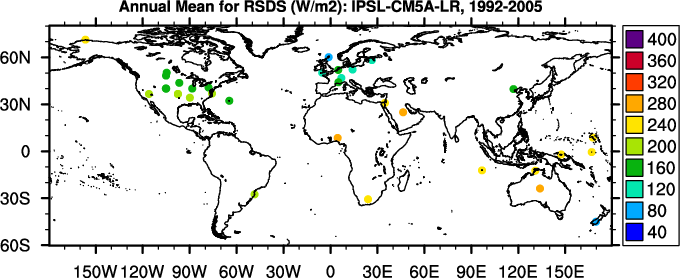
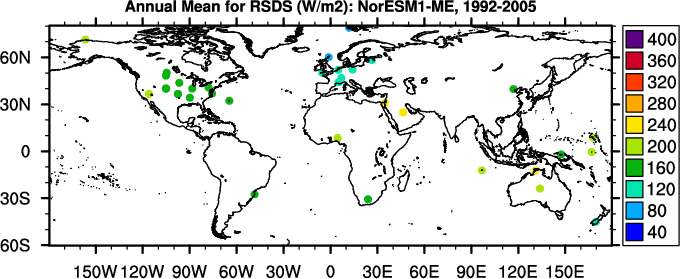
Annual Mean (W/m2)
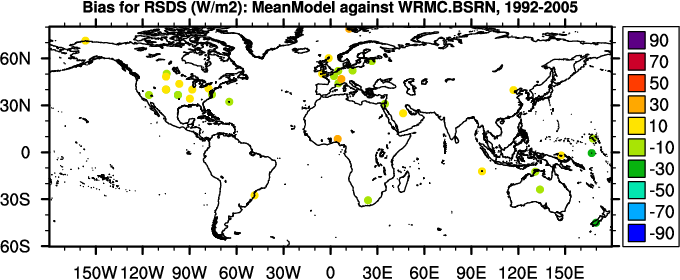
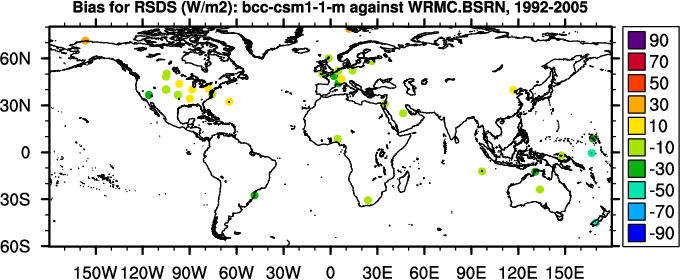
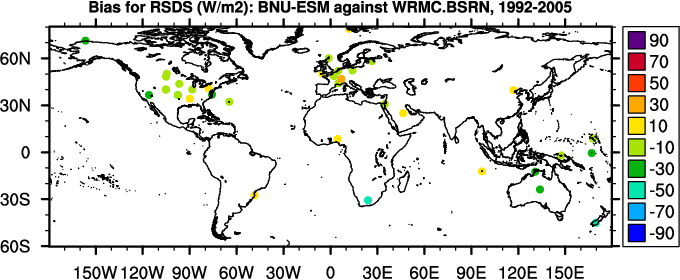
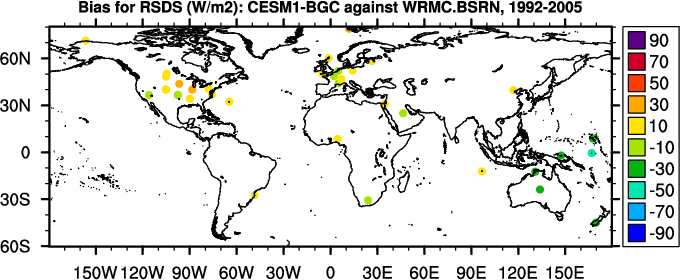
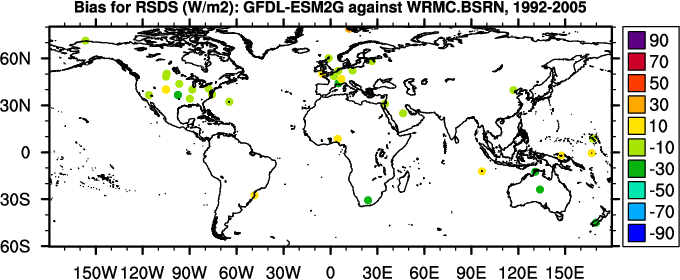
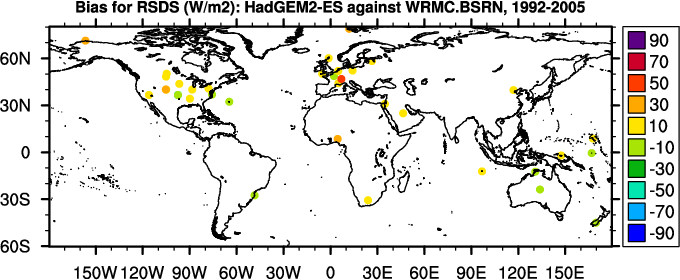
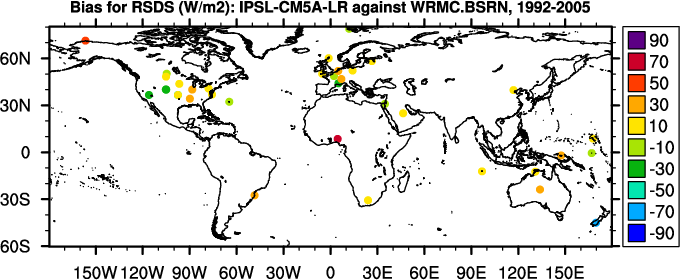
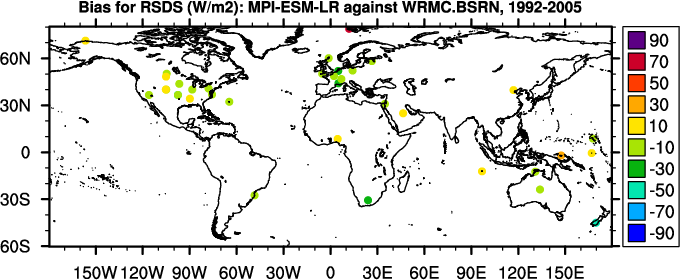
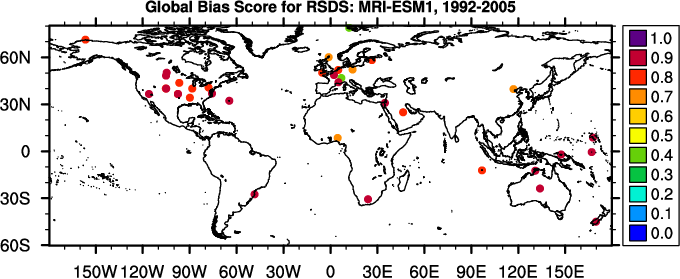
Bias (W/m2)
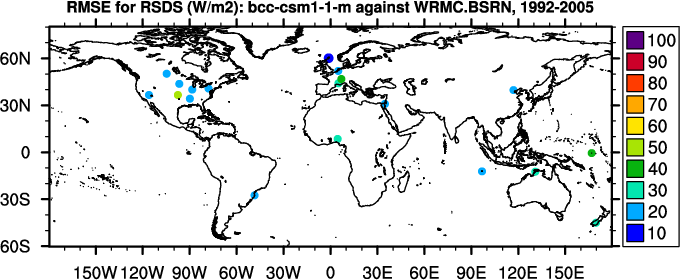
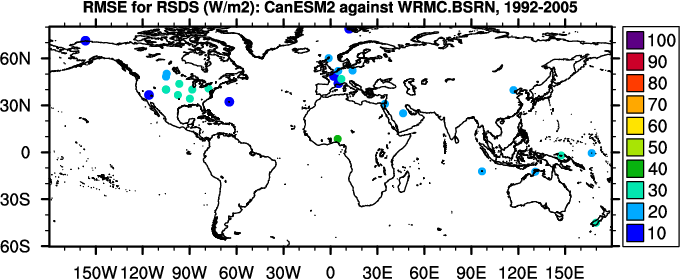
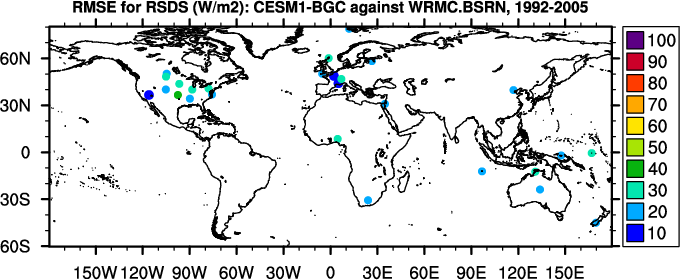
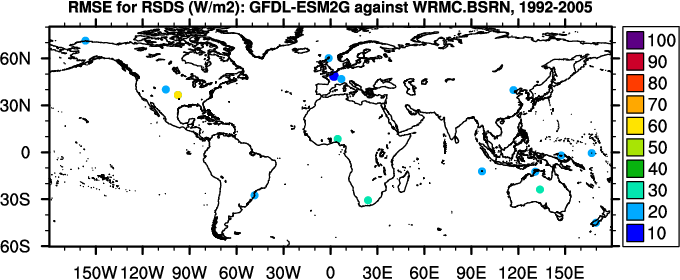
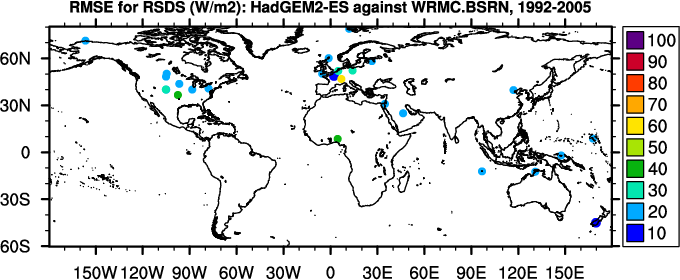
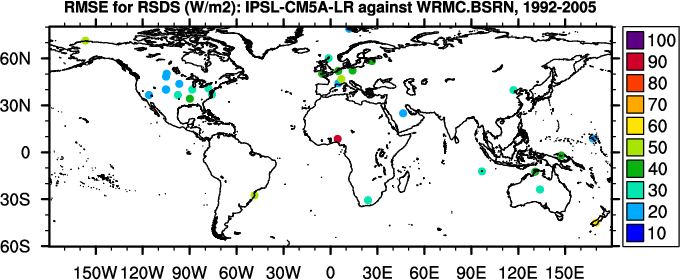
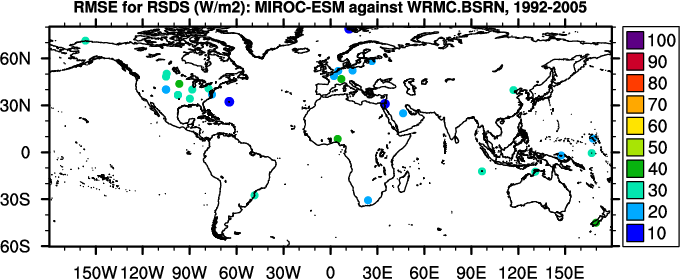
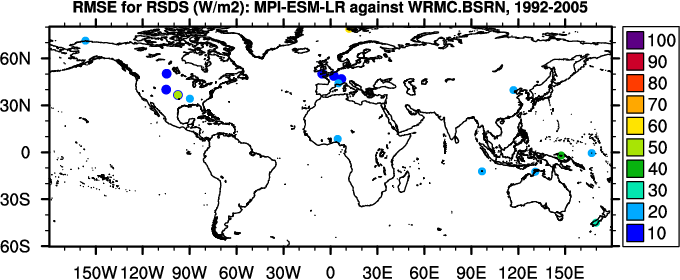
RMSE (W/m2)
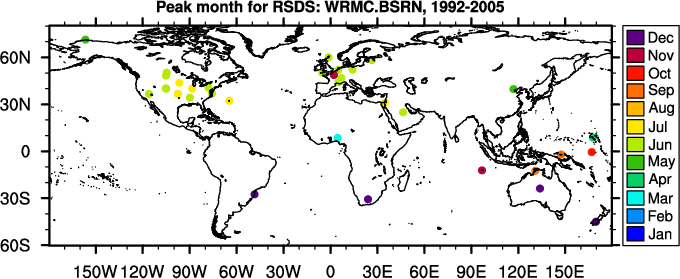
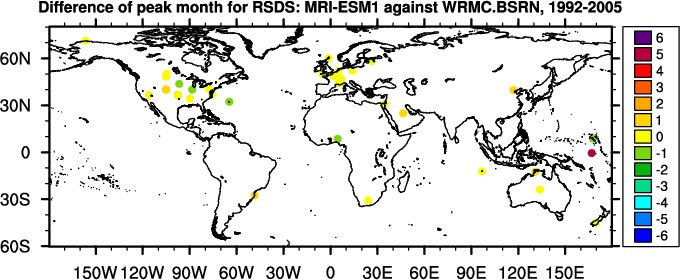
Phase Change (months)
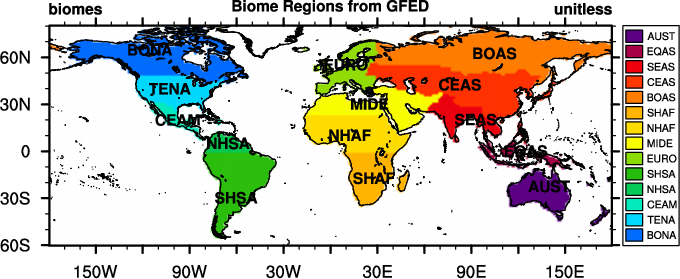
GFED
Regions
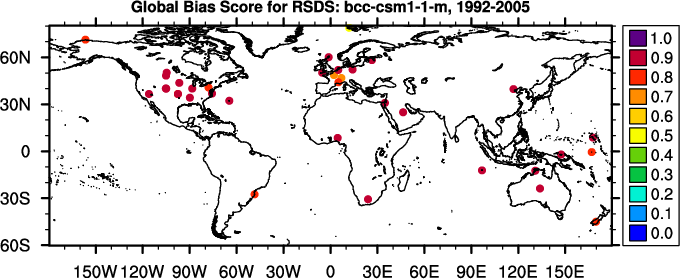
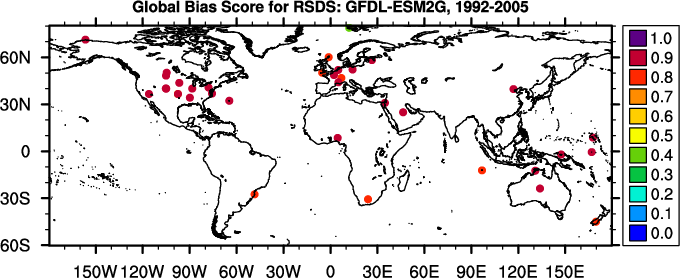
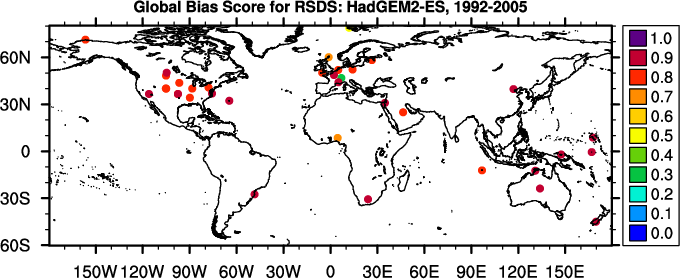
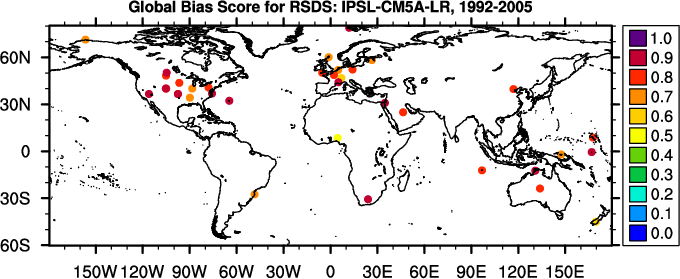
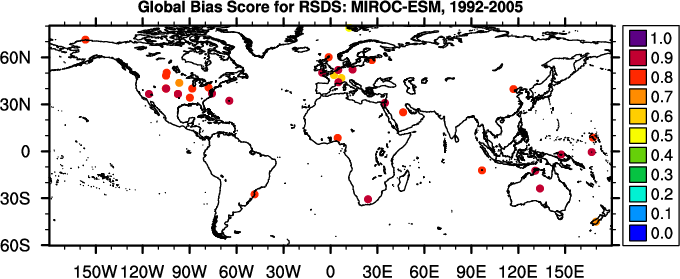
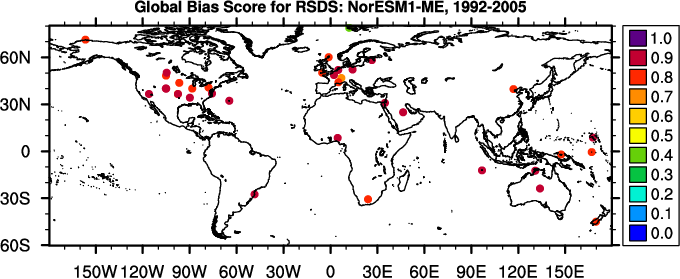
Global Bias
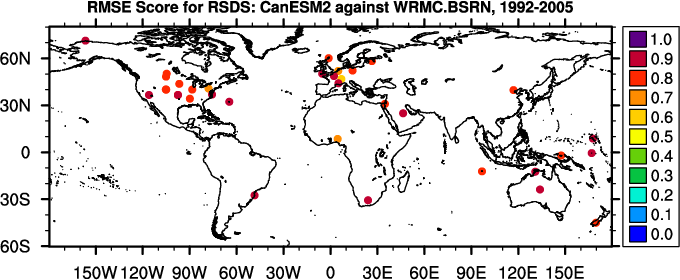
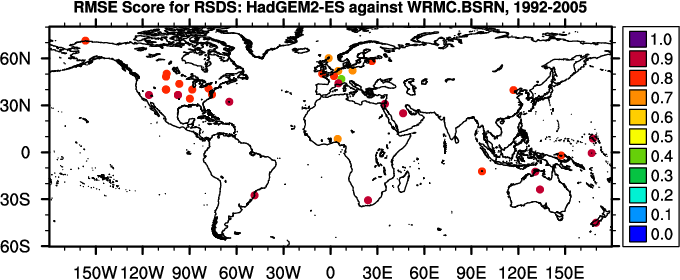
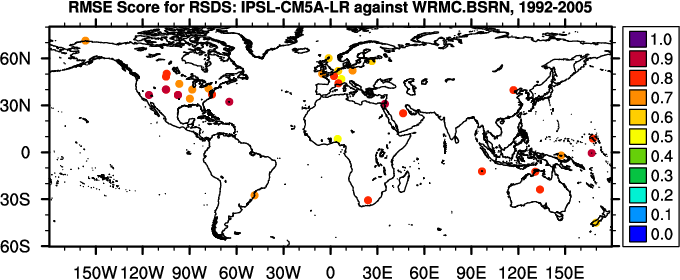
RMSE
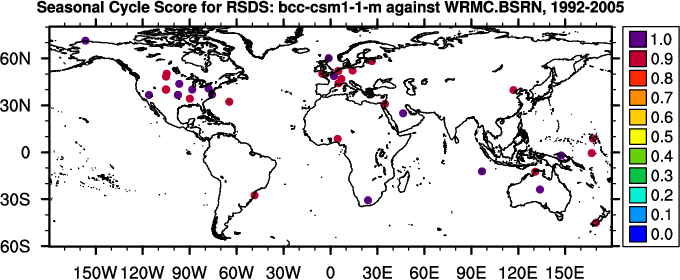
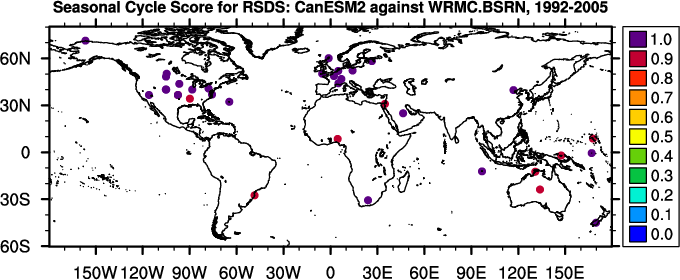
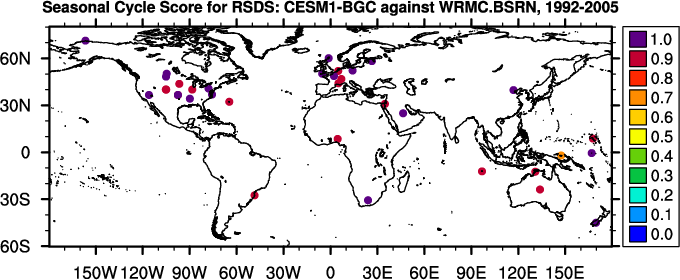
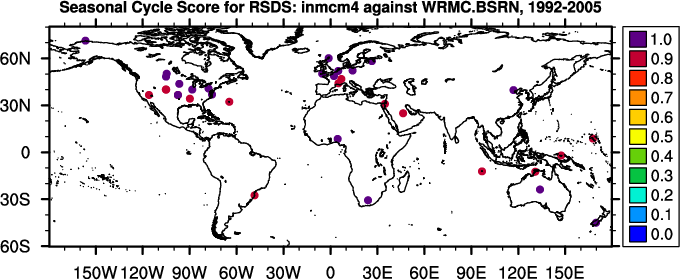
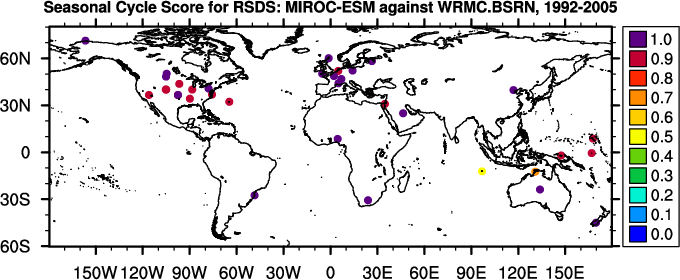
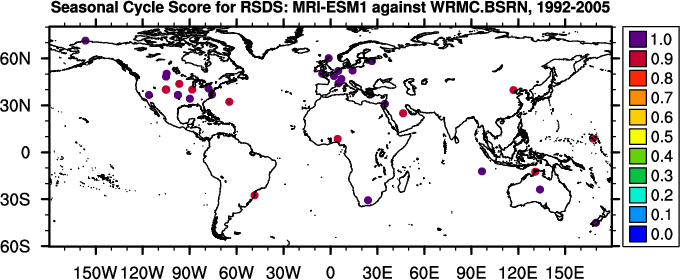
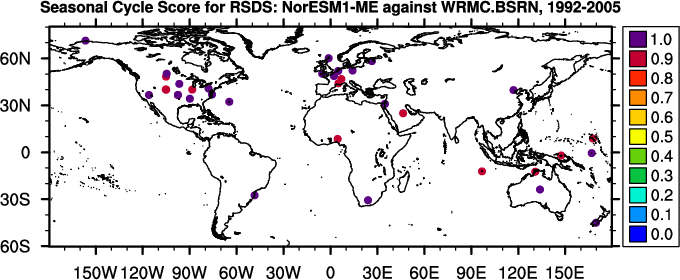
Seasonal Cycle
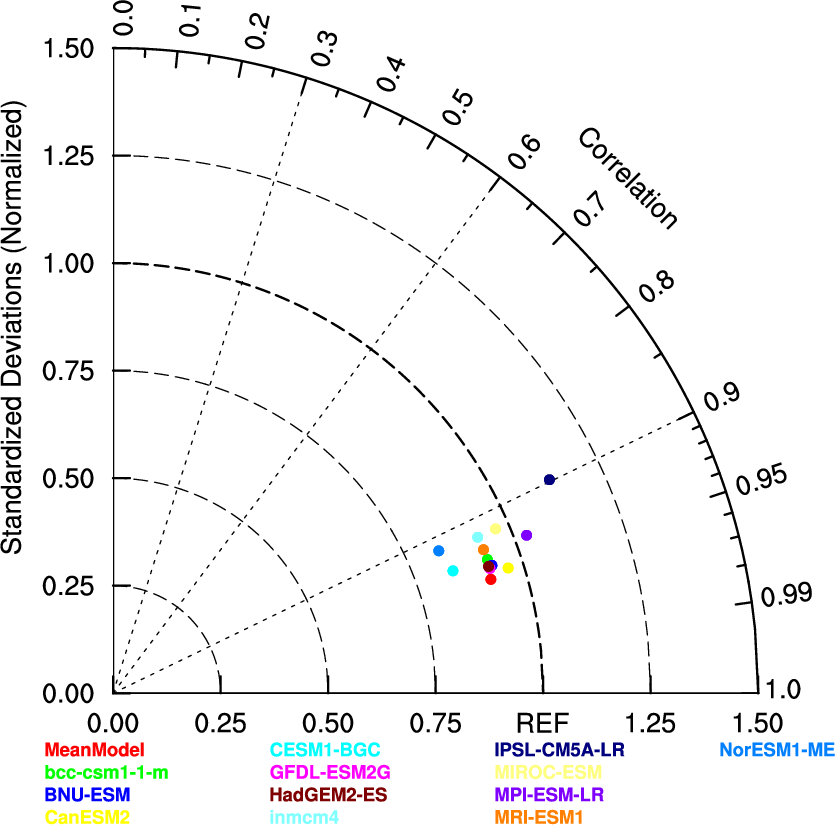
Spatial Distribution
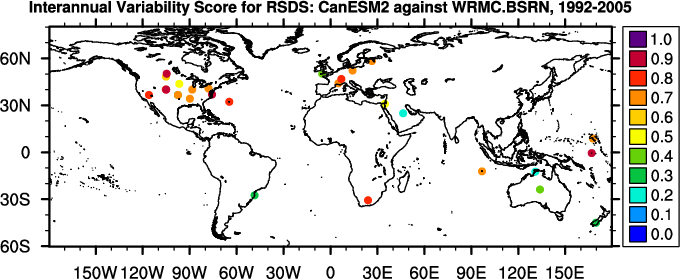
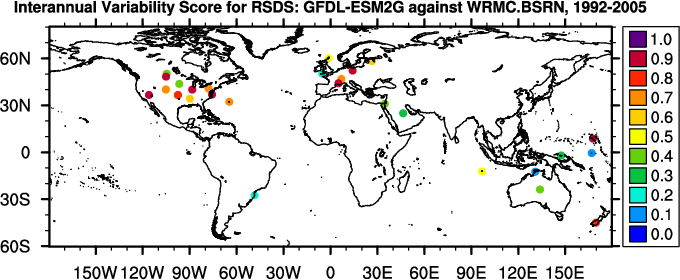
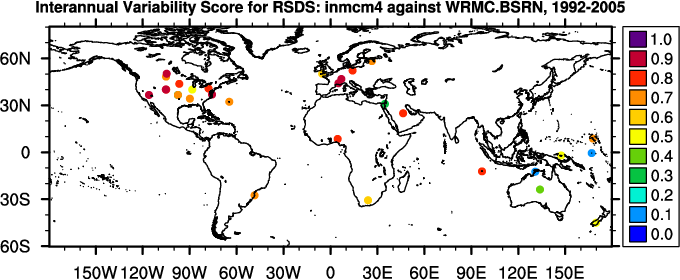
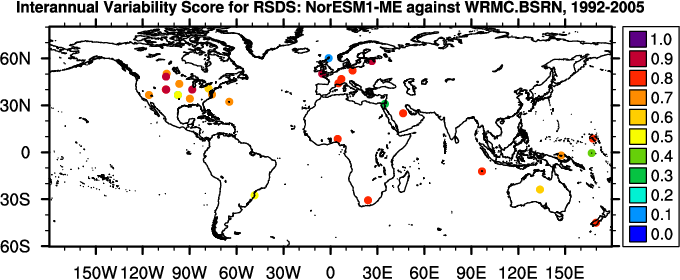
Interannual Variability
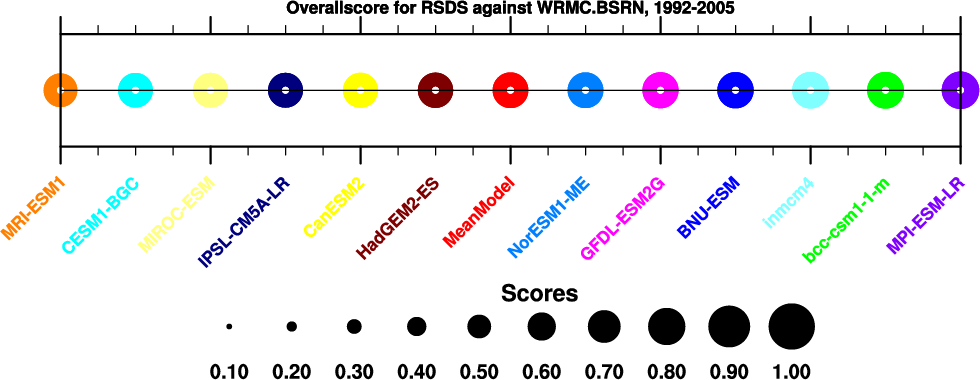
Overall
Benchmark
[Konig-Langl et al. (2013)]
181.4
-
-
1.0
access to
plots
-
-
-
-
-
1.00
MeanModel
189.2
7.8
19.1
0.2
access to
plots
0.91
0.90
0.98
0.97
0.50
0.77
bcc-csm1-1-m
179.3
-2.2
21.4
0.3
access to
plots
0.91
0.88
0.96
0.96
0.61
0.79
BNU-ESM
180.9
-0.5
21.7
0.3
access to
plots
0.92
0.88
0.95
0.97
0.54
0.78
CanESM2
191.0
9.6
22.1
0.1
access to
plots
0.91
0.88
0.98
0.98
0.53
0.75
CESM1-BGC
190.7
9.3
23.6
0.1
access to
plots
0.88
0.87
0.96
0.94
0.61
0.74
GFDL-ESM2G
182.3
0.9
20.6
0.3
access to
plots
0.92
0.89
0.95
0.97
0.51
0.77
HadGEM2-ES
198.1
16.7
24.6
0.2
access to
plots
0.87
0.86
0.97
0.97
0.60
0.76
inmcm4
195.6
14.2
25.7
0.4
access to
plots
0.87
0.87
0.94
0.95
0.59
0.78
IPSL-CM5A-LR
198.0
16.6
35.2
0.4
access to
plots
0.85
0.81
0.89
0.94
0.56
0.75
MIROC-ESM
191.0
9.6
27.2
0.2
access to
plots
0.87
0.85
0.95
0.96
0.54
0.75
MPI-ESM-LR
185.8
4.4
19.9
0.5
access to
plots
0.91
0.90
0.92
0.97
0.57
0.80
MRI-ESM1
196.3
14.9
26.0
-0.0
access to
plots
0.88
0.86
0.92
0.96
0.60
0.72
NorESM1-ME
181.4
-0.0
22.9
0.2
access to
plots
0.90
0.88
0.98
0.92
0.61
0.77
Notes: In calculating overall score, rmse score contributes double in comparison with all other scores.