| Metric | Metric components |
Observations & companion protocol |
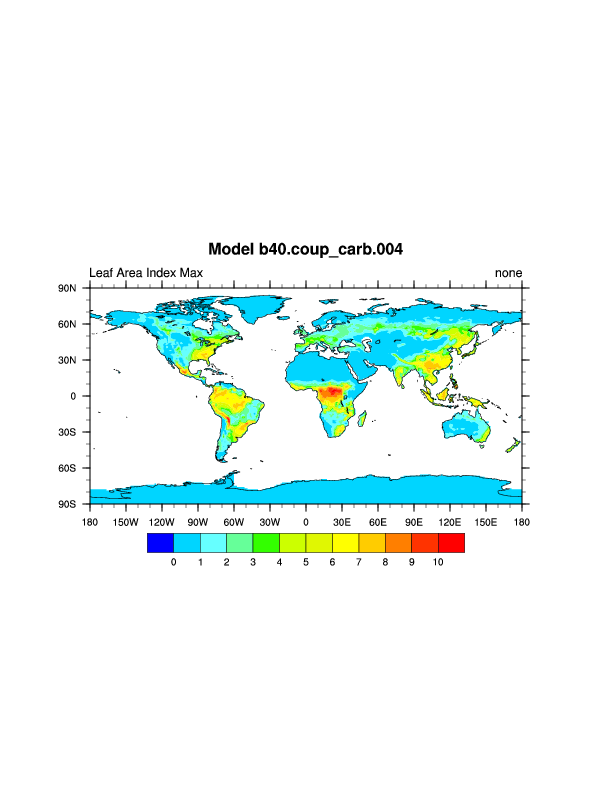
Model b40.coup_carb.004 |
Score (points) | |
|---|---|---|---|---|---|
| Full | b40.coup_carb.004 | ||||
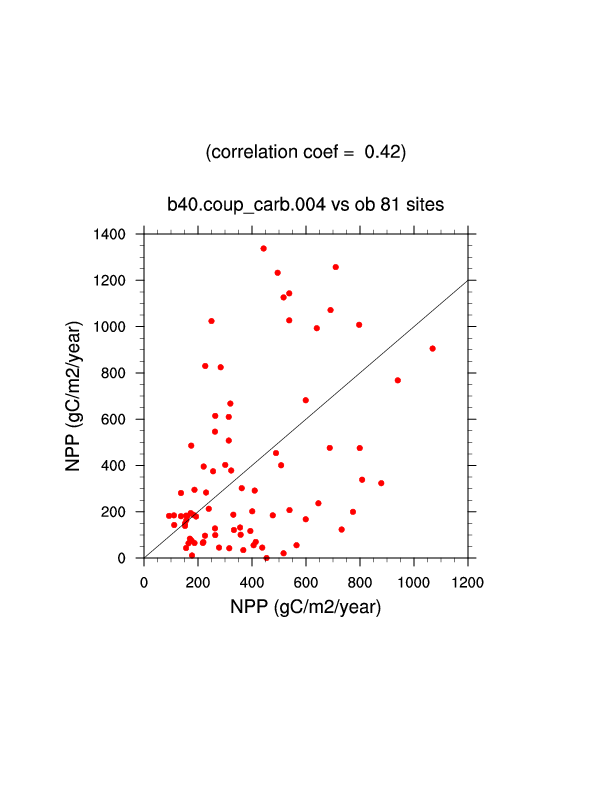
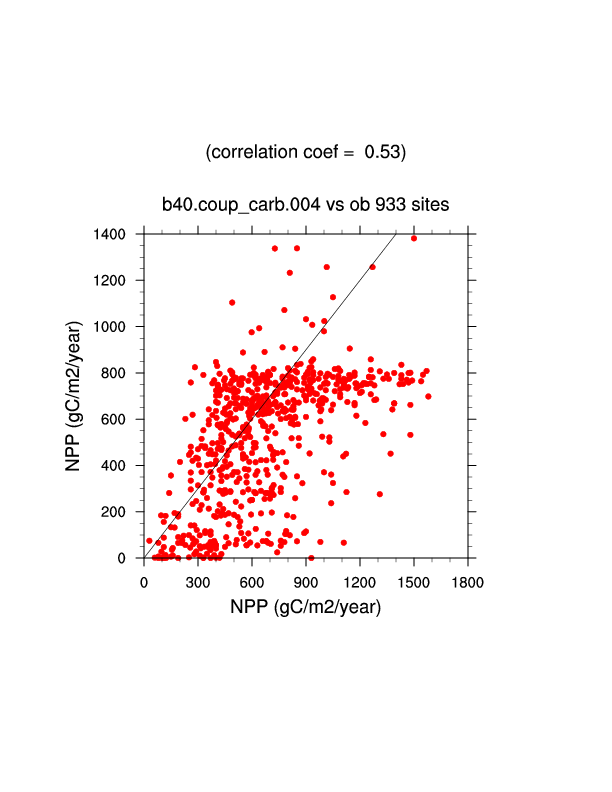
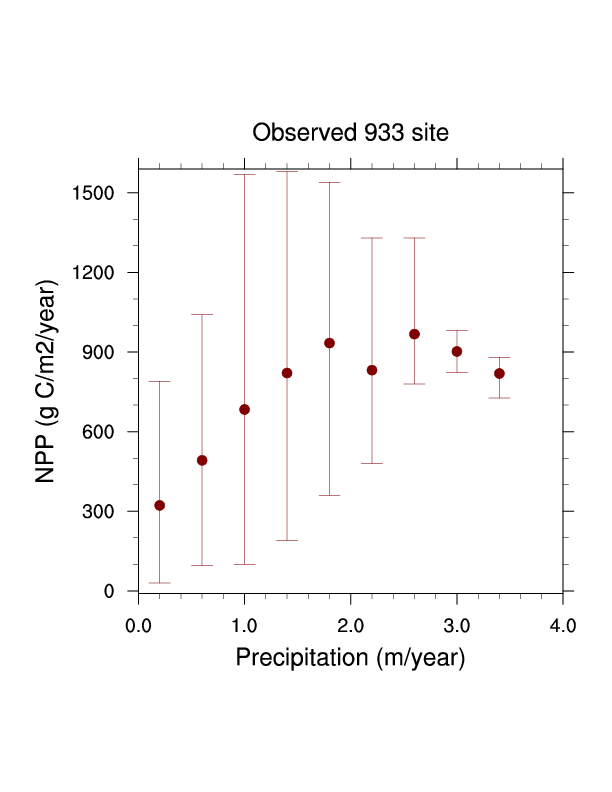
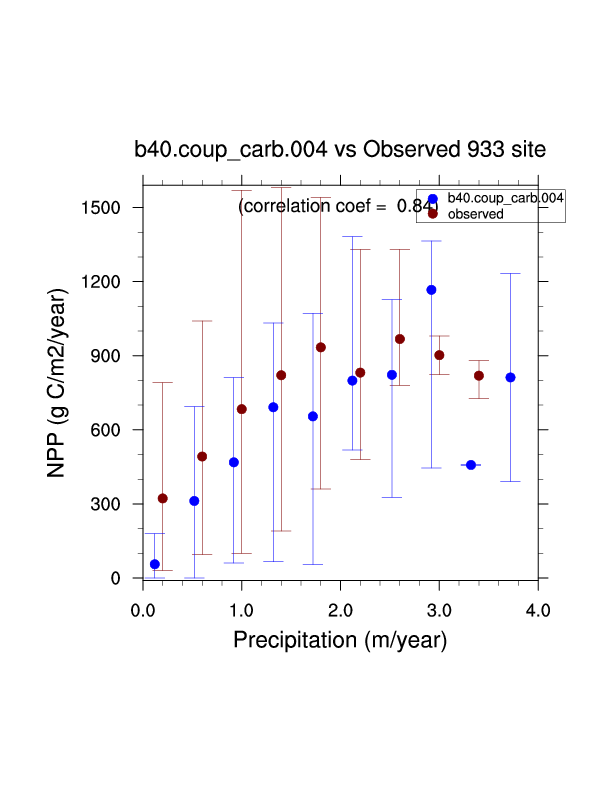
| NPP | EMDI NPP observations |
ClassA_table |
model_vs_obs_table scatter_plot |
2.5 | 0.86 |
| ClassB_table |
model_vs_obs_table scatter_plot |
2.5 | 1.32 | ||
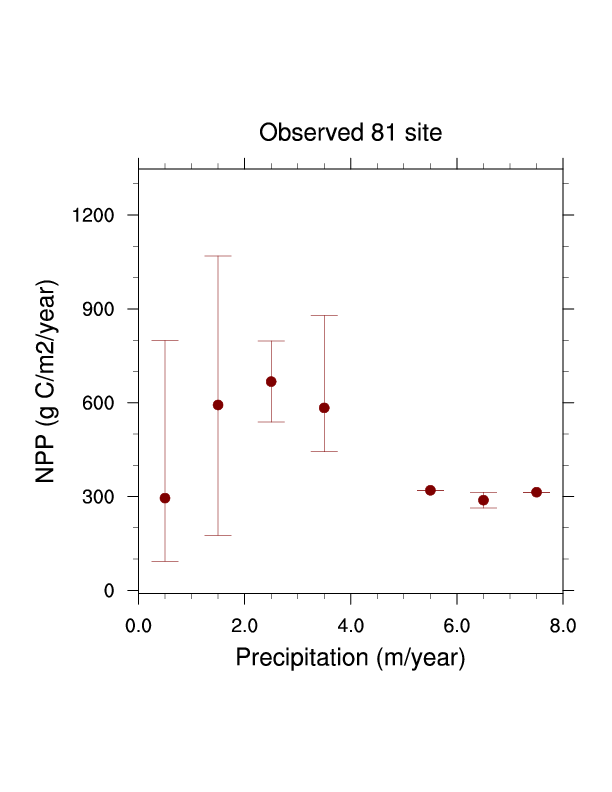
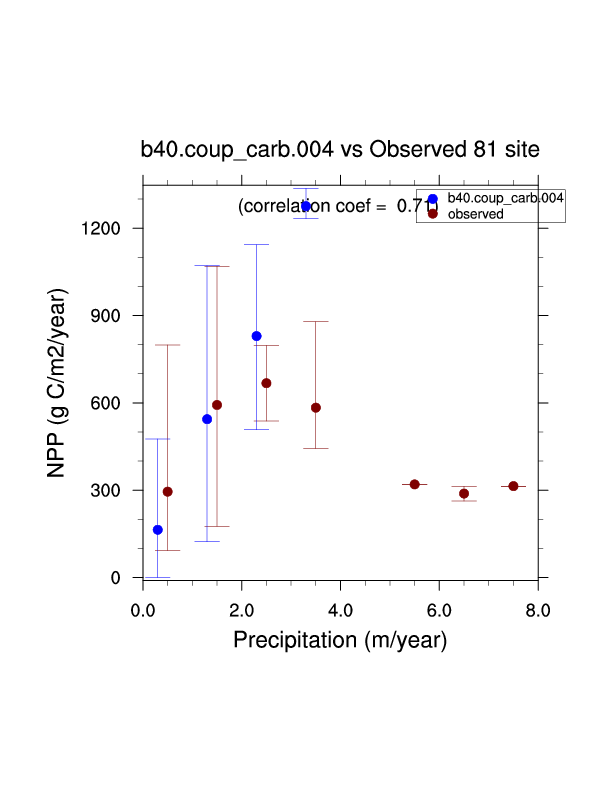
| EMDI NPP normalized by PPT |
ClassA_histogram | ClassA_histogram | 2.5 | 1.44 | |
| ClassB_histogram | ClassB_histogram | 2.5 | 1.08 | ||
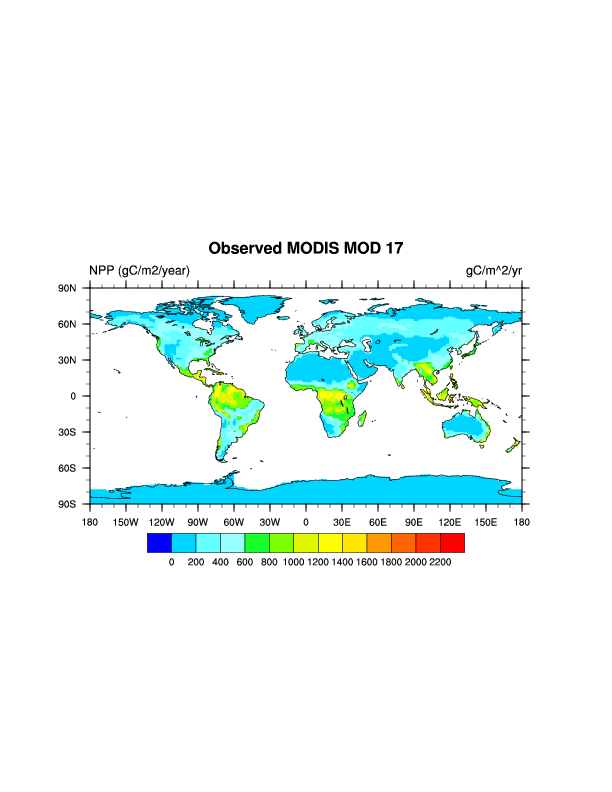
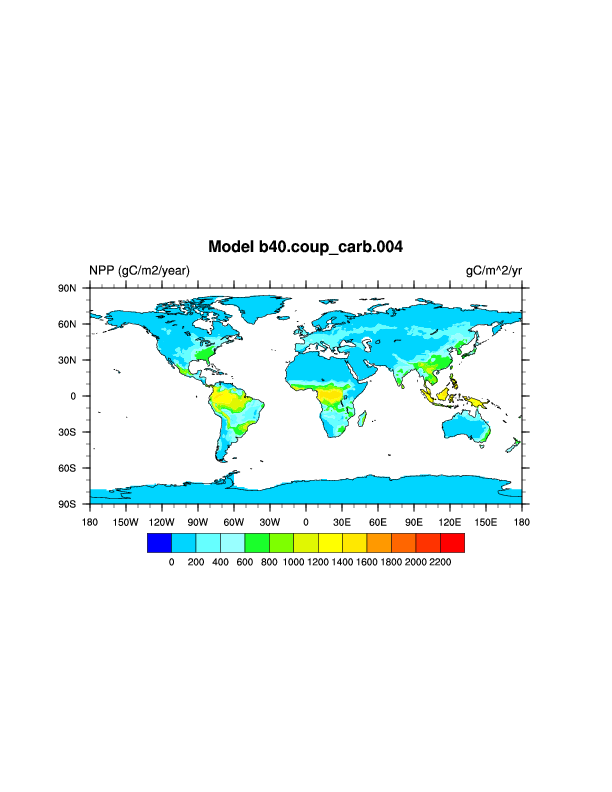
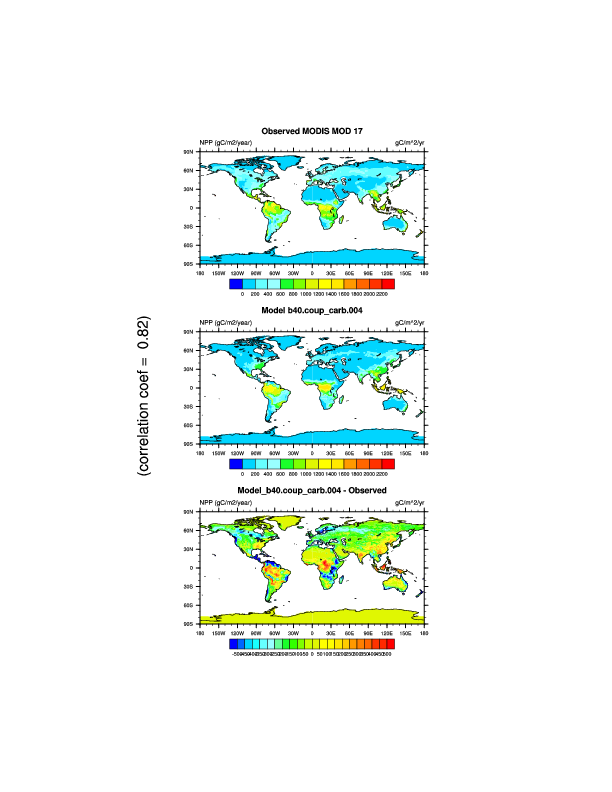
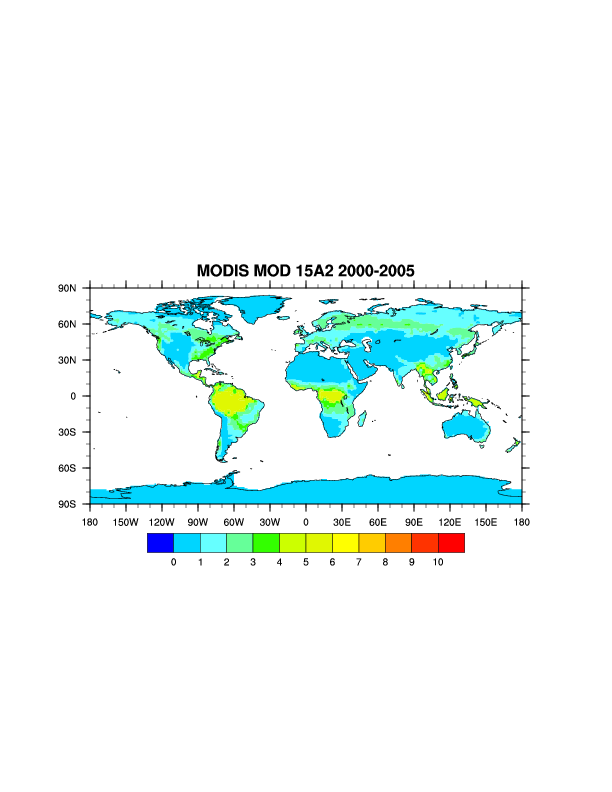
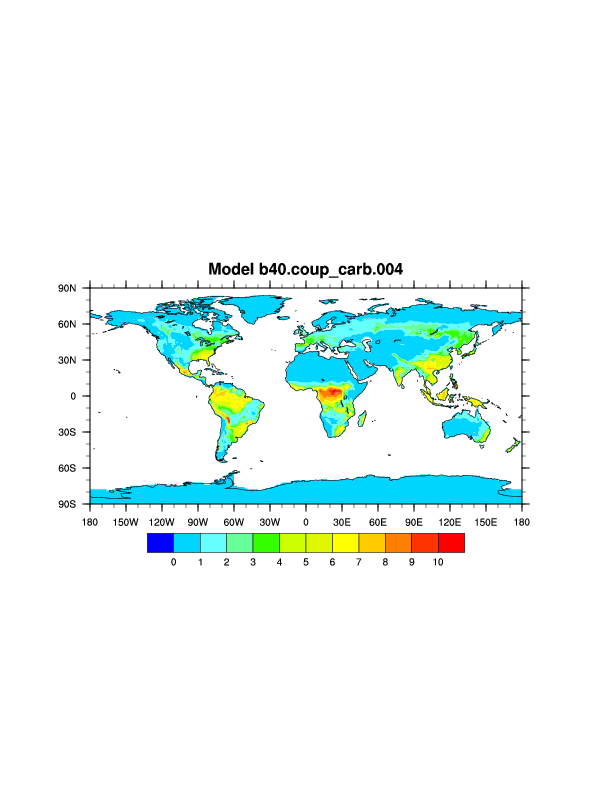
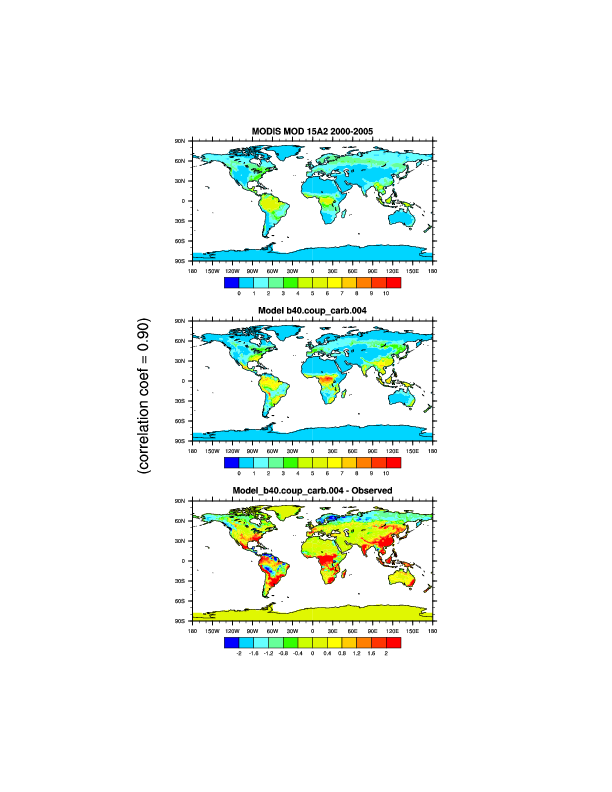
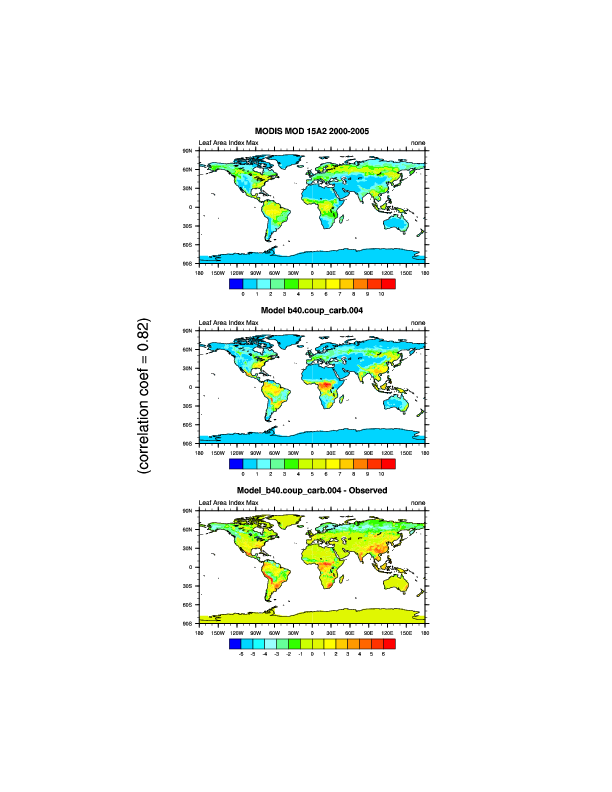
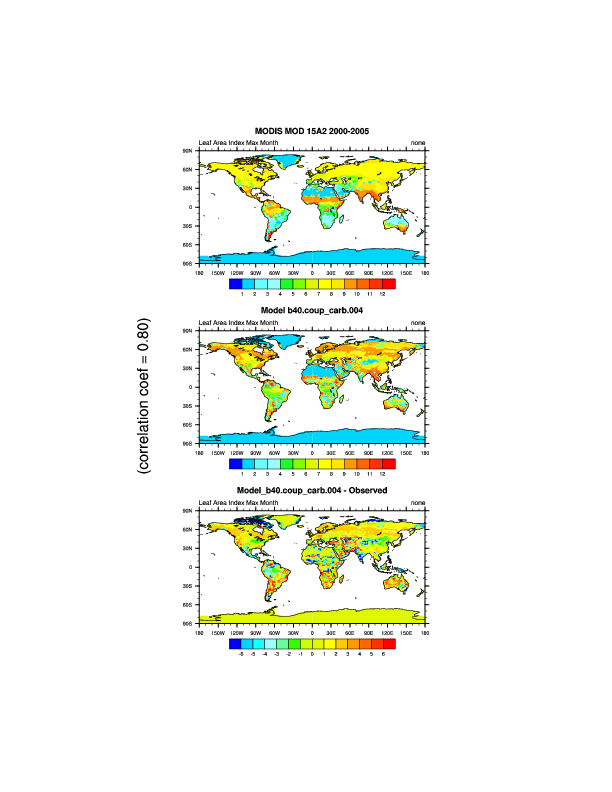
| Correlation with MODIS obs. | global_map |
model_map model_vs_obs |
5 | 2.46 | |
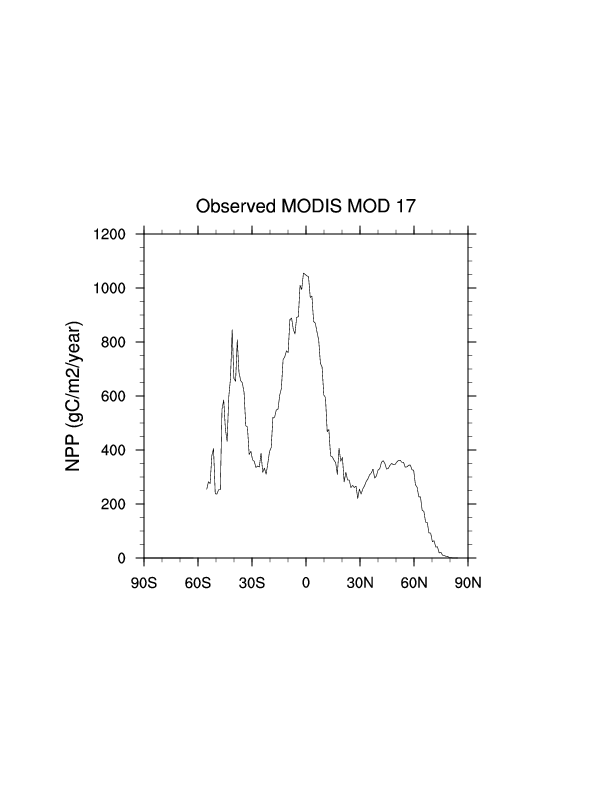
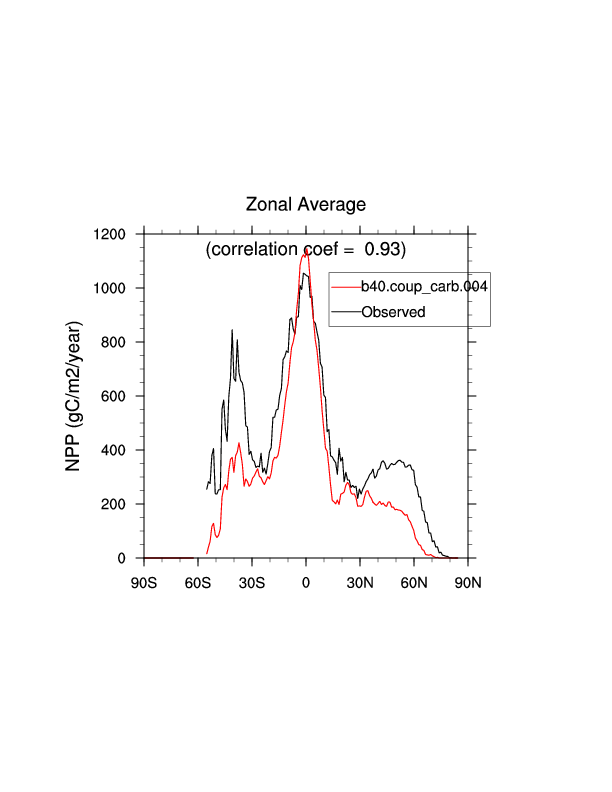
| Correlation with MODIS-zonal mean | zonal_mean_obs |
zonal_mean model_vs_obs_plot |
5 | 3.72 | |
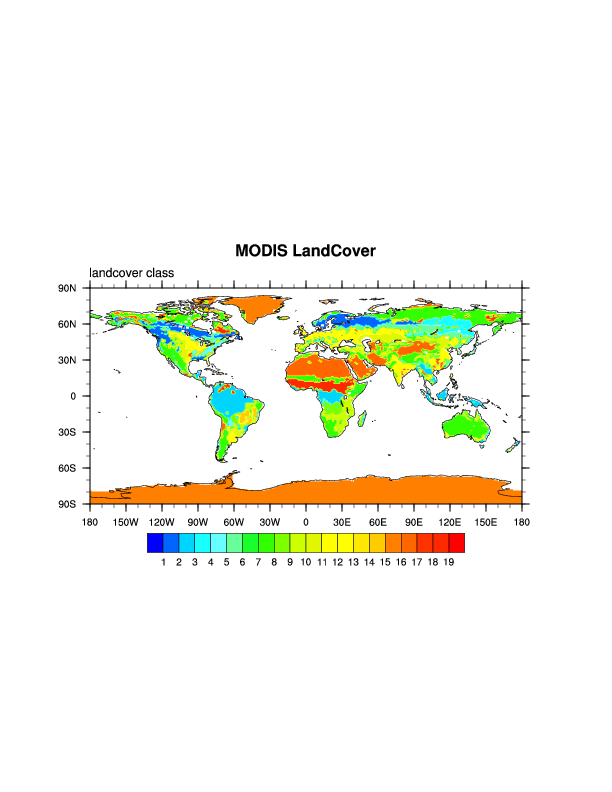
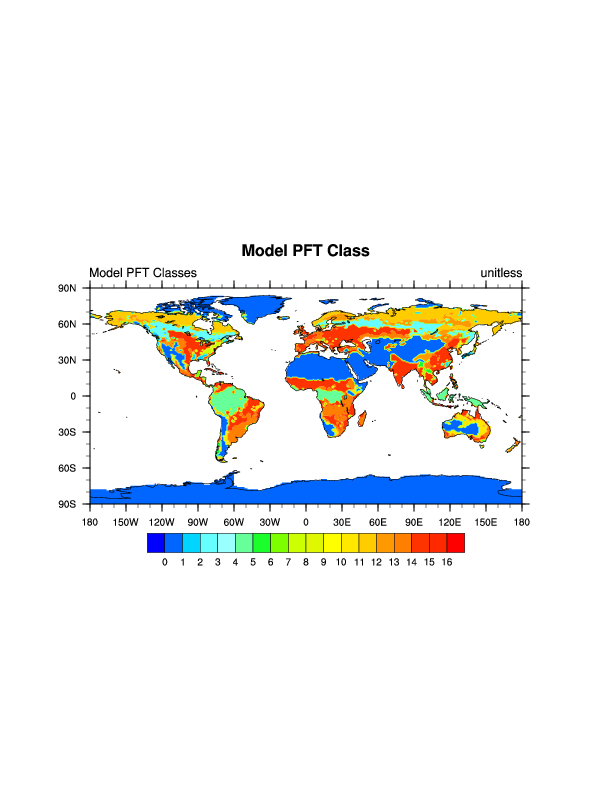
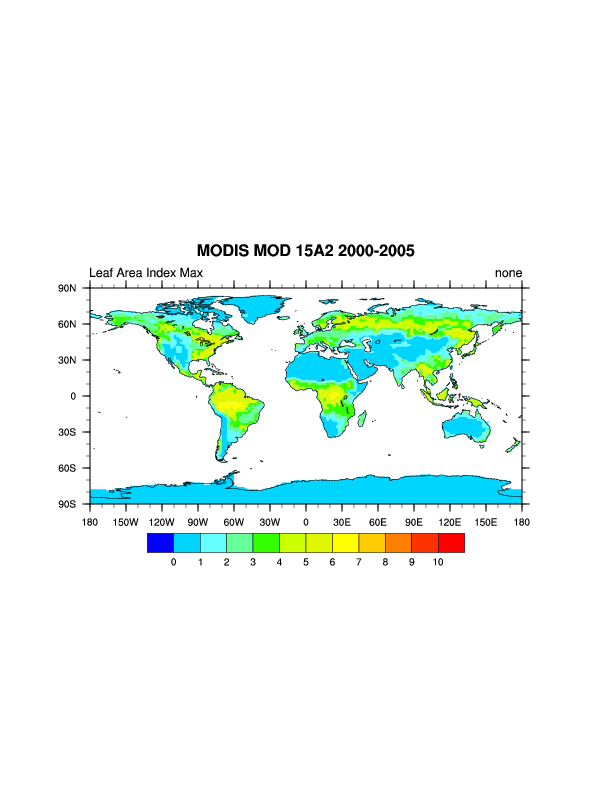
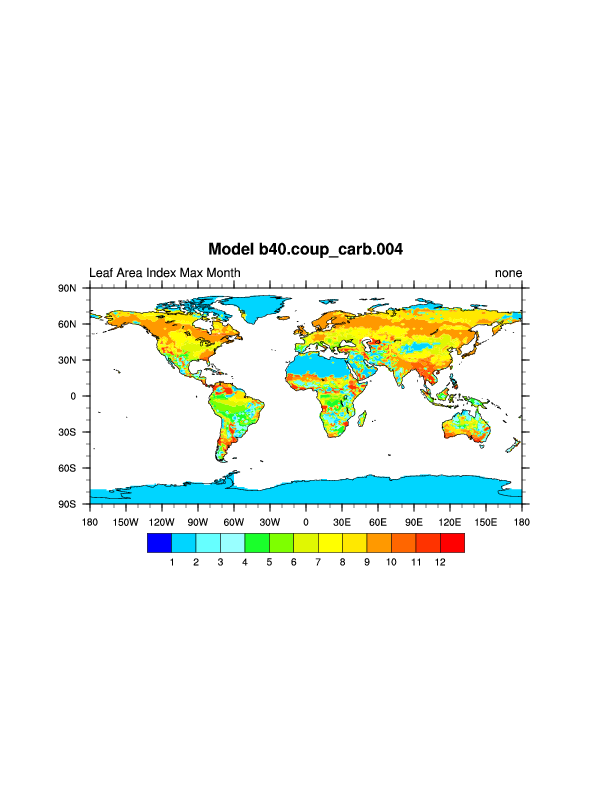
| LAI | MODIS Mean |
land_class_obs land_class_model global_map |
model_vs_obs_table global_map model_vs_obs |
5 | 4.50 |
| MODIS Maximum | global_map |
global_map model_vs_obs |
5 | 4.44 | |
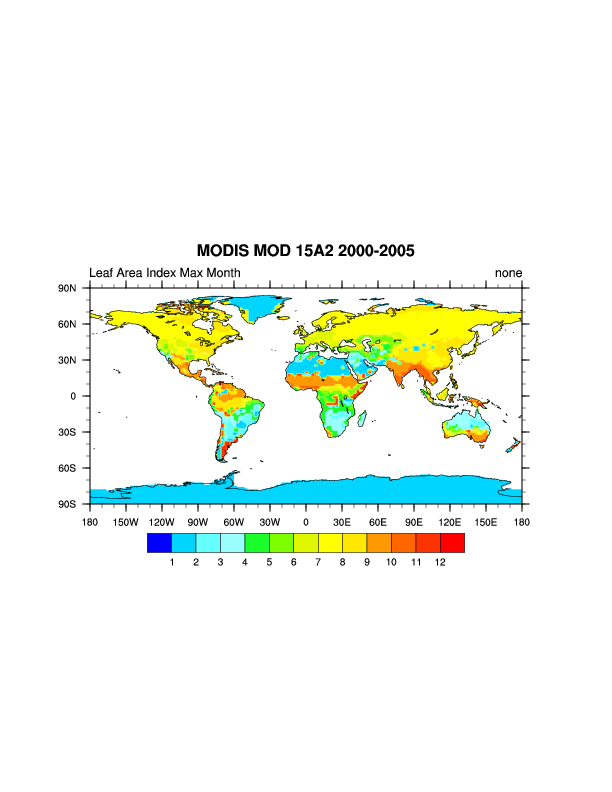
| MODIS Phase | global_map |
global_map |
5 | 4.27 | |
| CO2 Seasonal Cycle |
Comparison with NOAA observations phase and amplitude |
-- | -- | 20 | -- |
| Carbon Stocks |
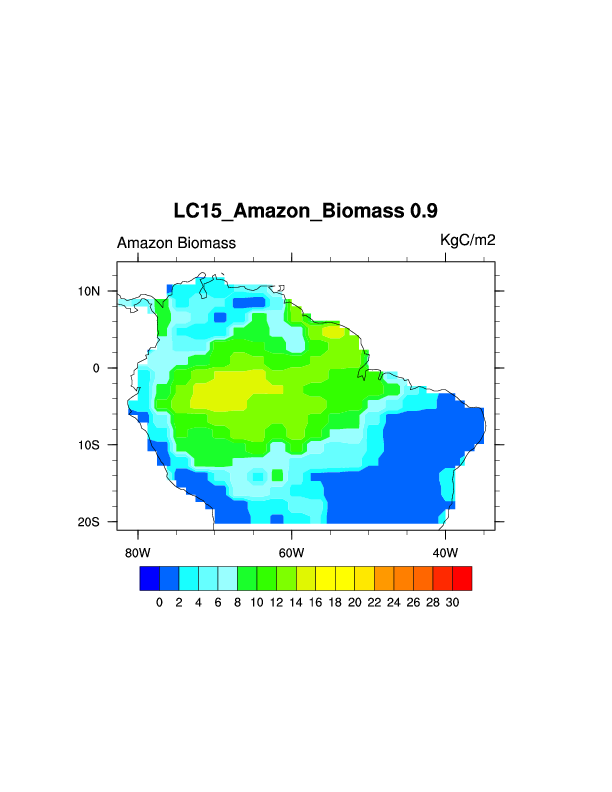
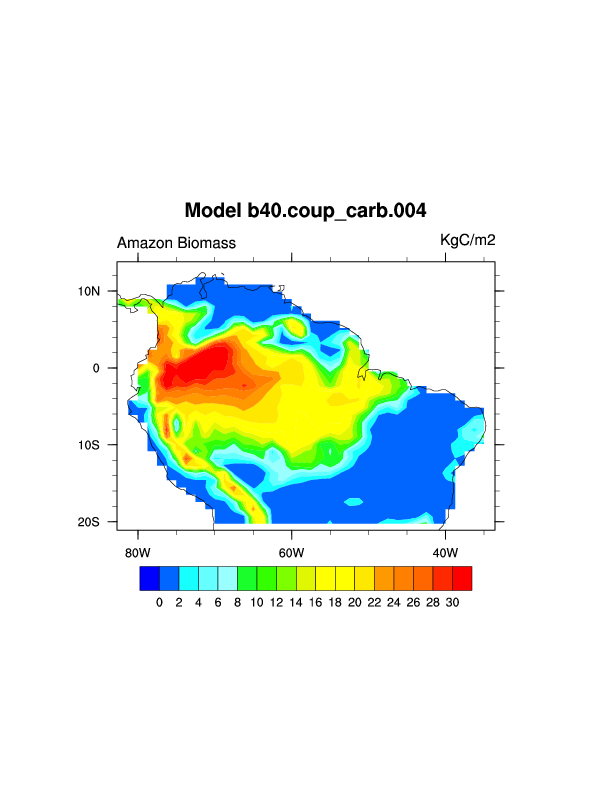
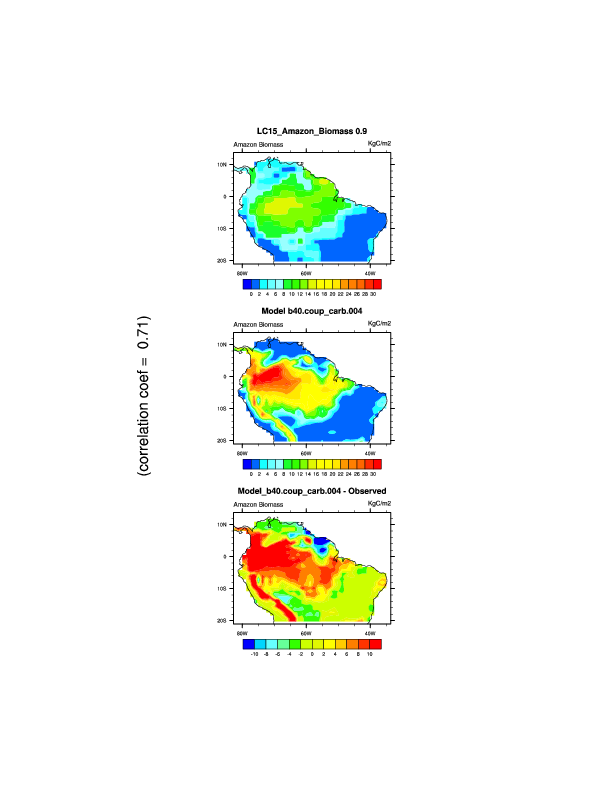
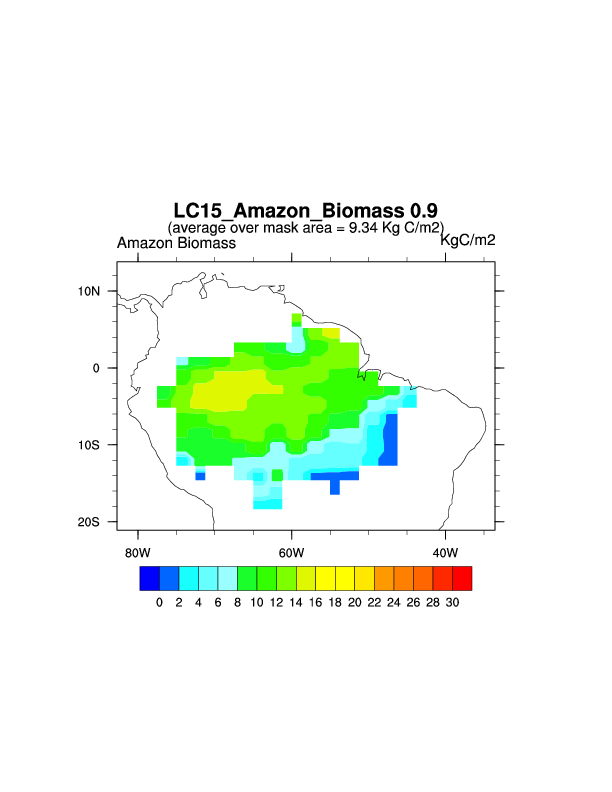
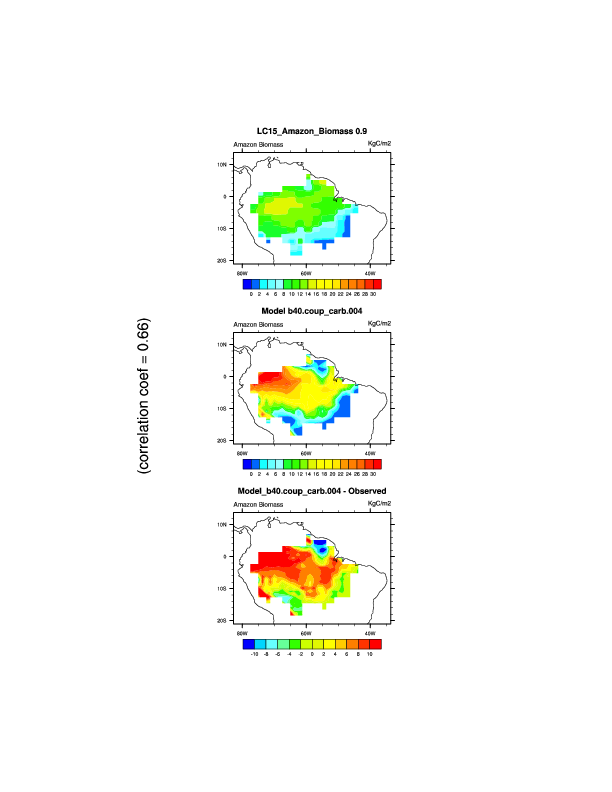
Aboveground biomass within Amazon Basin (spatial pattern) |
obs_amazon |
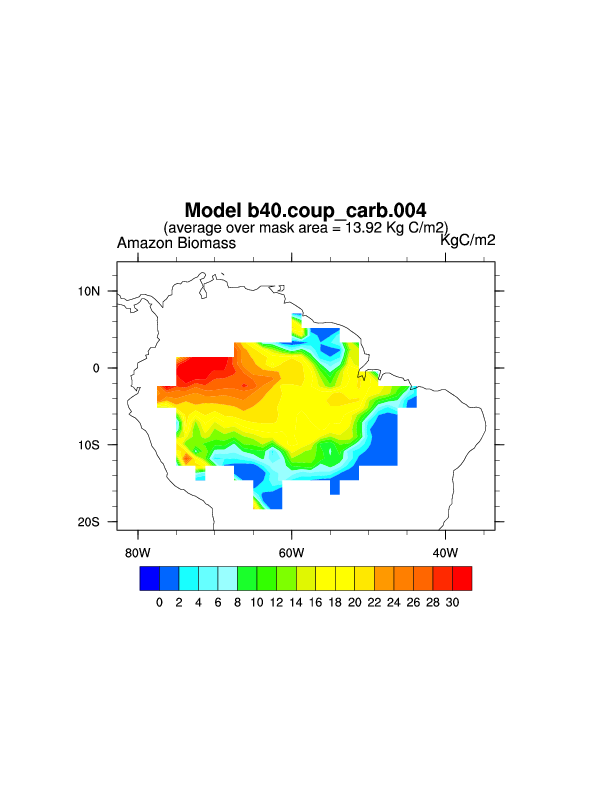
model_amazon model_vs_obs |
5 | 2.69 |
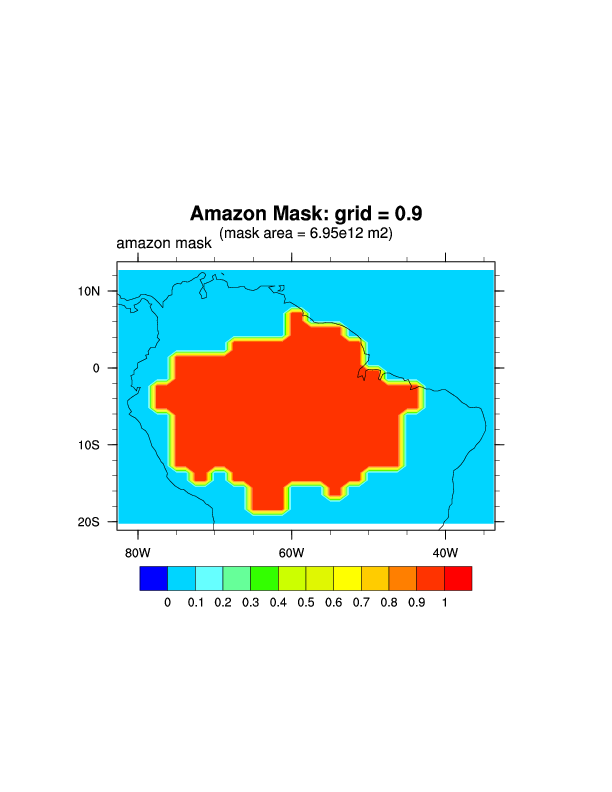
| Aboveground biomass within Amazon Basin (sum within Legal Amazon) |
mask_plot obs_masked 64.88 (Pg C) |
model_masked model_vs_obs 96.65 (Pg C) |
5 | 3.42 | |
| Energy and C Fluxes from Fluxnet |
NEE | line_plot | model_vs_obs | 5 | 2.09 |
| Net radiation | 5 | 3.54 | |||
| Latent heat | 5 | 3.50 | |||
| Sensible heat | 5 | 3.55 | |||
| Energy and C Fluxes from Ameriflux |
NEE | line_plot |
model_vs_obs timeseries_plot |
1 | 0.40 |
| Shortwave Incoming | 1 | 0.89 | |||
| Latent heat | 1 | 0.74 | |||
| Sensible heat | 1 | 0.71 | |||
| GPP | 1 | 0.58 | |||
| ER | 1 | 0.70 | |||
| Transient Dynamics | Beta factor for NPP Stimulation from elevated CO2 | -- |
FACE_comparison biome_table |
3 | 0.00 |
| Turnover times and pool sizes | -- |
table_Leaf table_Wood table_Fine_Root table_Litter table_Coarse_Woody_Debris table_Soil |
3 | -- | |
| EL Nino anomaly 1998 (NEE and fire components) |
-- |
table_per_m2 table_per_biome |
2 | -- | |
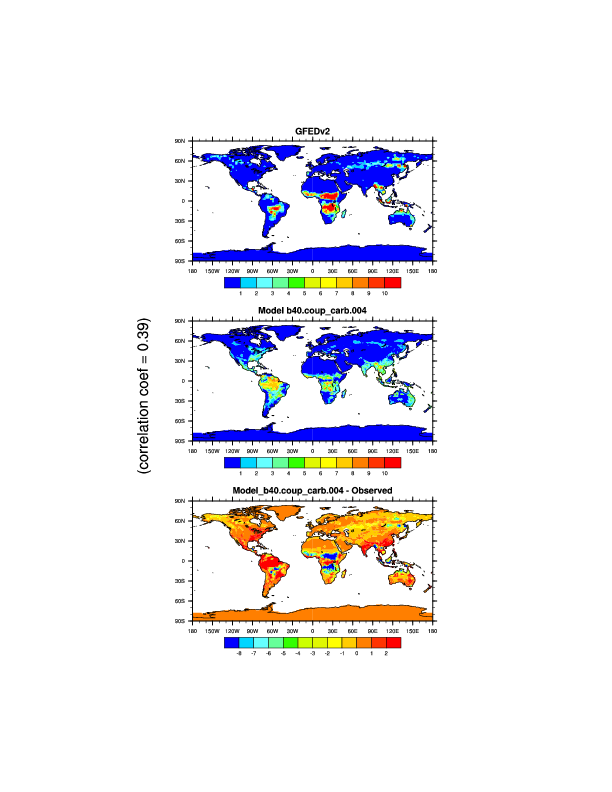
| Fire Variability | -- |
global_spatial_comparison temporal_dynamics(1997-2004) |
2 | 0.67 | |
| Total | 100 | 0.00 | |||