
clm45bgccrop_0.5deg4506_1972.58-62
and
clm45bgccrop_0.5deg4506_1972.8-12
Set 1 Description: Line plots of annual trends in energy balance, soil water/ice and temperature, runoff, snow water/ice, photosynthesis
Lookup Table: Set 1 Variable Definition
| Trend | vs Difference | ||
|---|---|---|---|
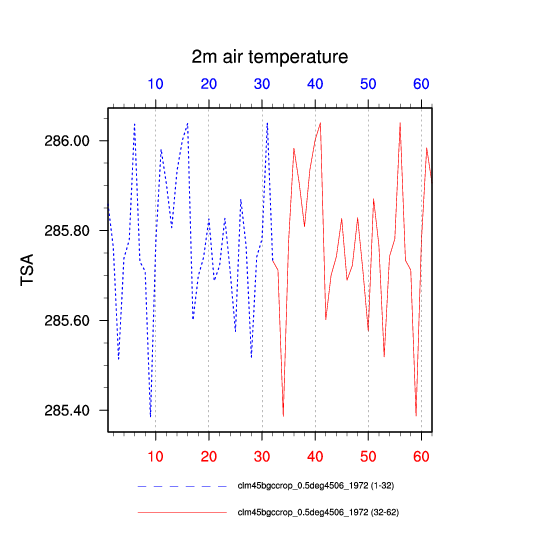
| 2m air temperature (TSA) | plot | DifferencePlot | |
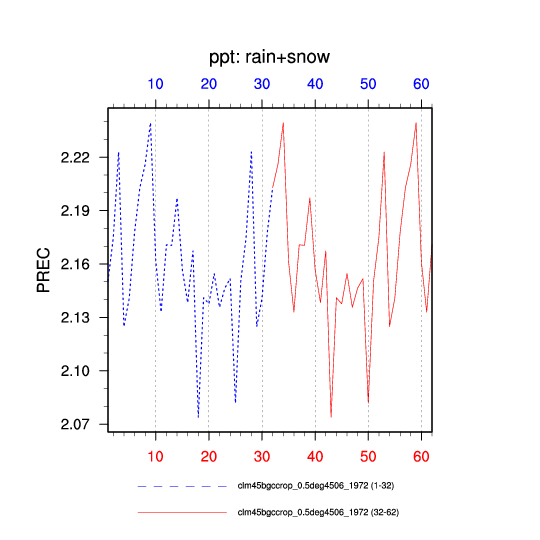
| ppt: rain+snow (PREC) | plot | --- | |
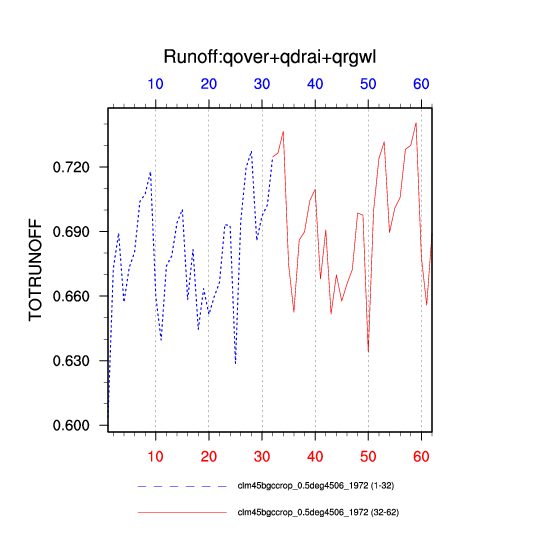
| Runoff:qover+qdrai+qrgwl (TOTRUNOFF) | plot | --- | |
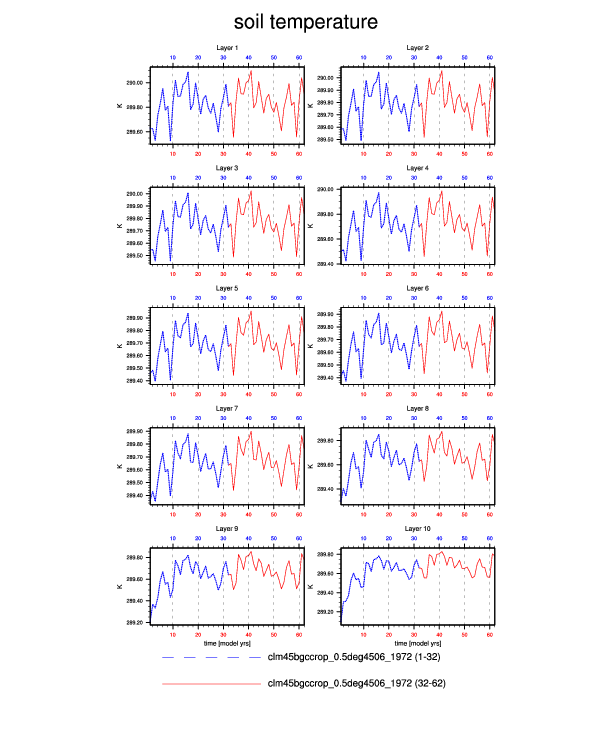
| soil temperature: layers 1,5,10 (TSOI) | plot | --- | |
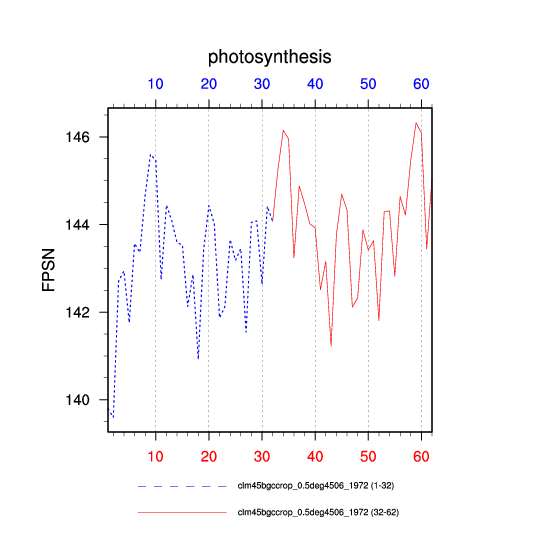
| photosynthesis (FPSN) | plot | --- | |
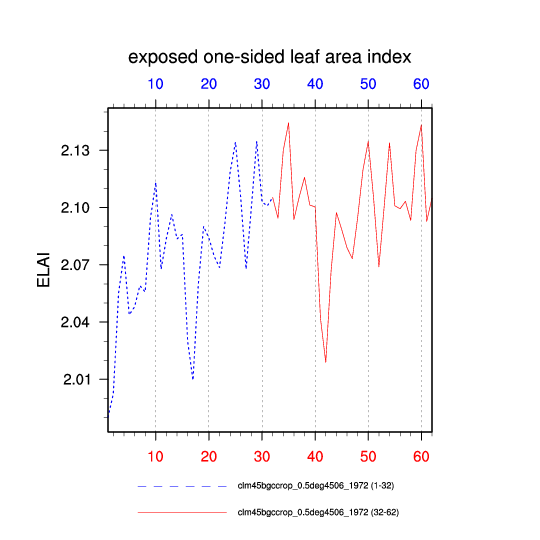
| exposed one-sided leaf area index (ELAI) | plot | --- | |
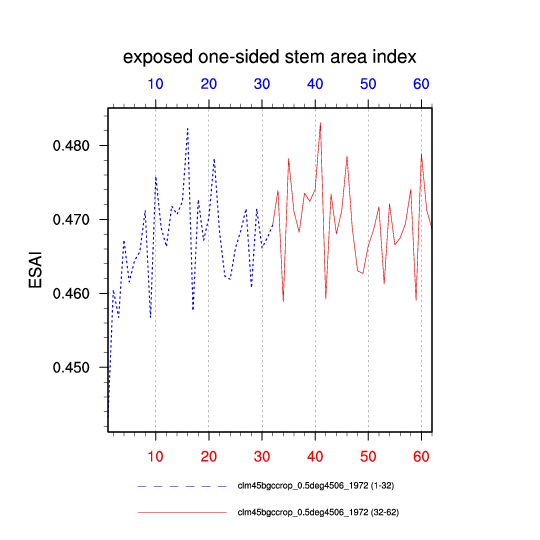
| exposed one-sided stem area index (ESAI) | plot | --- | |
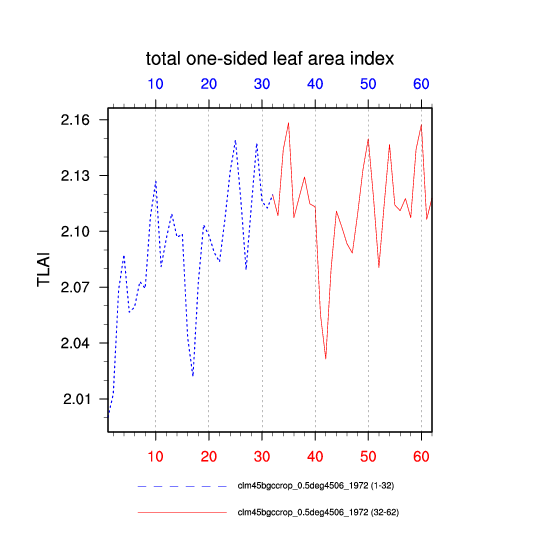
| total one-sided leaf area index (TLAI) | plot | --- | |
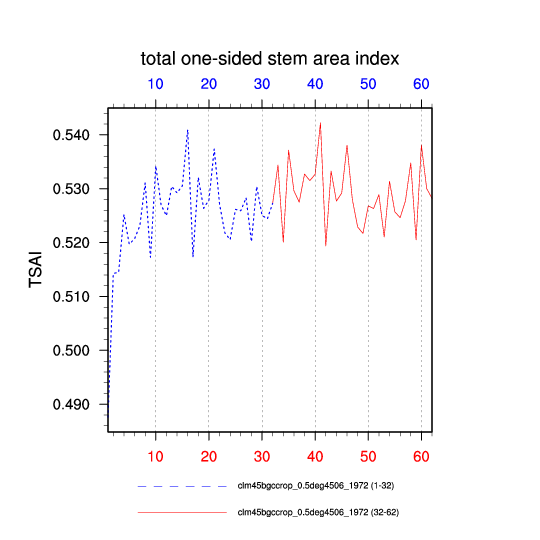
| total one-sided stem area index (TSAI) | plot | --- | |
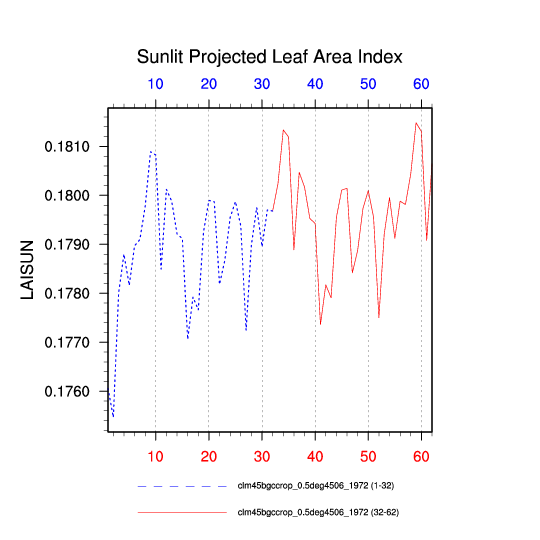
| Sunlit Projected Leaf Area Index (LAISUN) | plot | --- | |
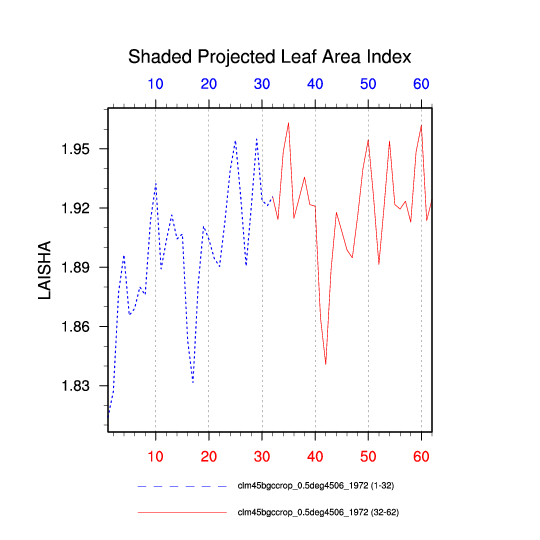
| Shaded Projected Leaf Area Index (LAISHA) | plot | --- | |
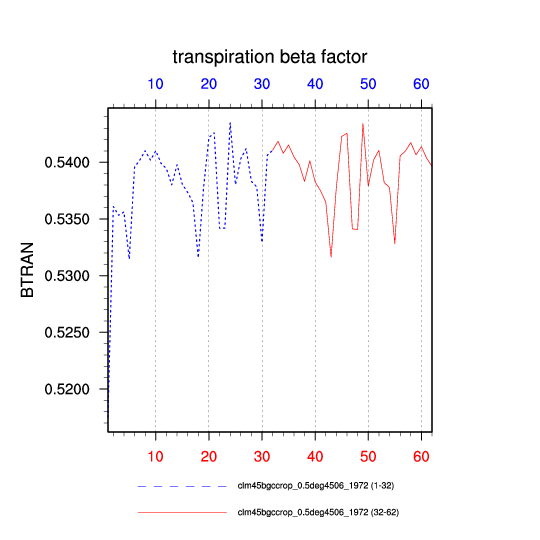
| transpiration beta factor (BTRAN) | plot | --- | |
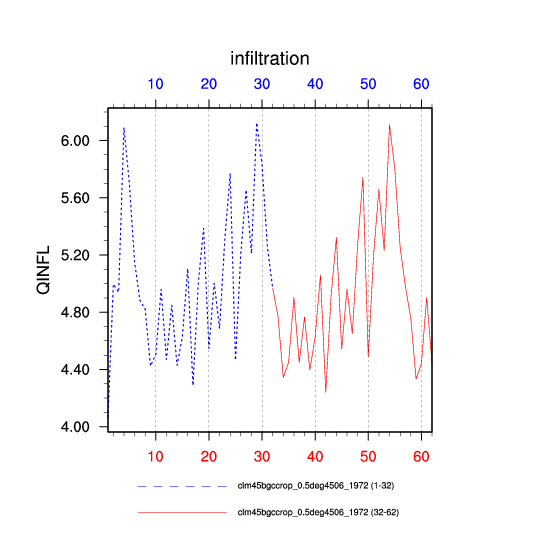
| infiltration (QINFL) | plot | --- | |
| surface runoff (QOVER) | plot | --- | |
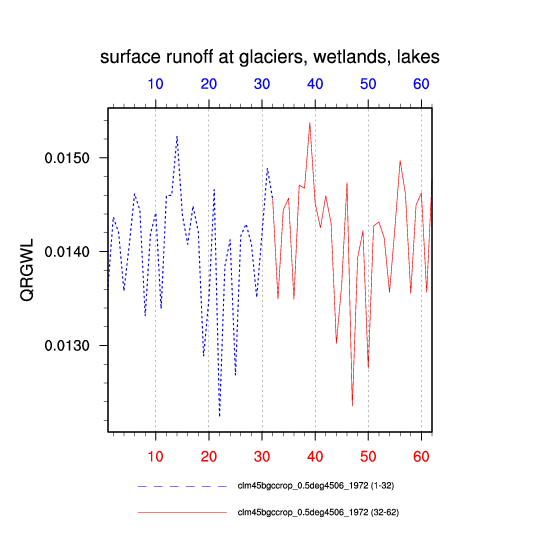
| surface runoff at glaciers, wetlands, lakes (QRGWL) | plot | --- | |
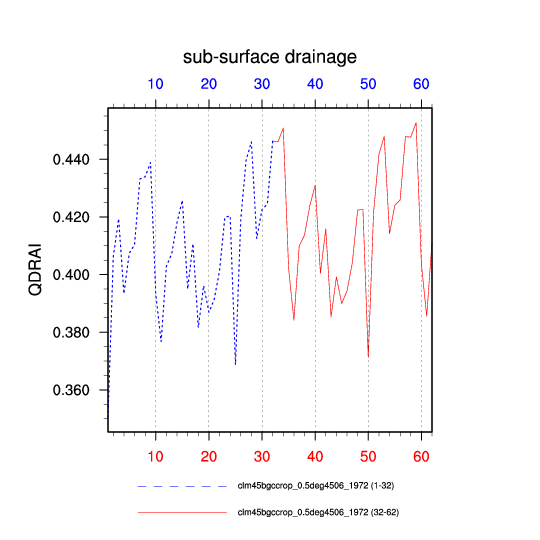
| sub-surface drainage (QDRAI) | plot | --- | |
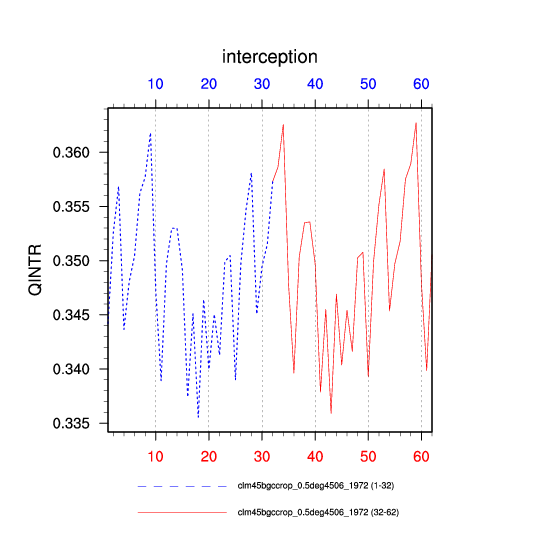
| interception (QINTR) | plot | --- | |
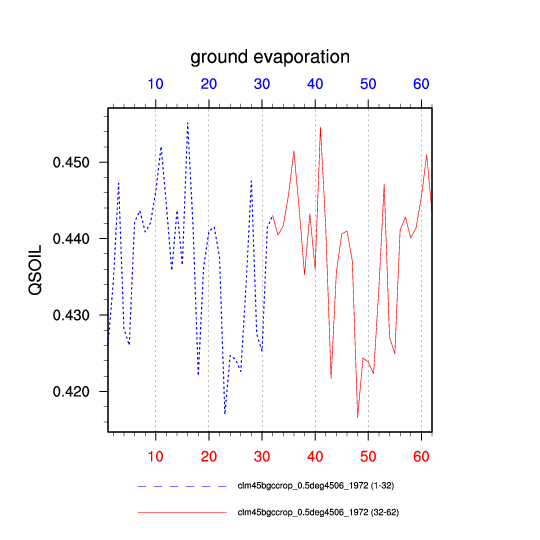
| ground evaporation (QSOIL) | plot | --- | |
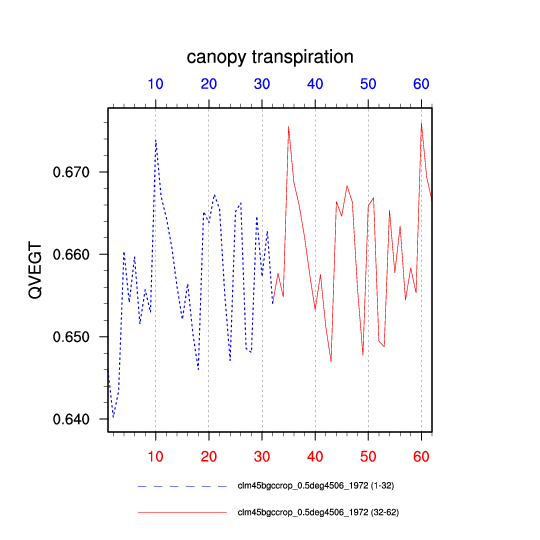
| canopy transpiration (QVEGT) | plot | --- | |
| soil liquid water: layers 1,5,10 (SOILLIQ) | plot | --- | |
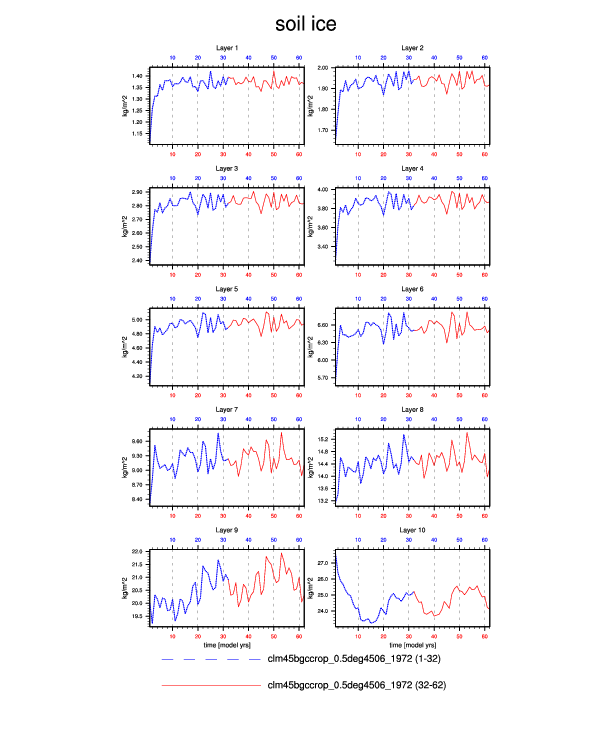
| soil ice: layers 1,5,10 (SOILICE) | plot | --- | |
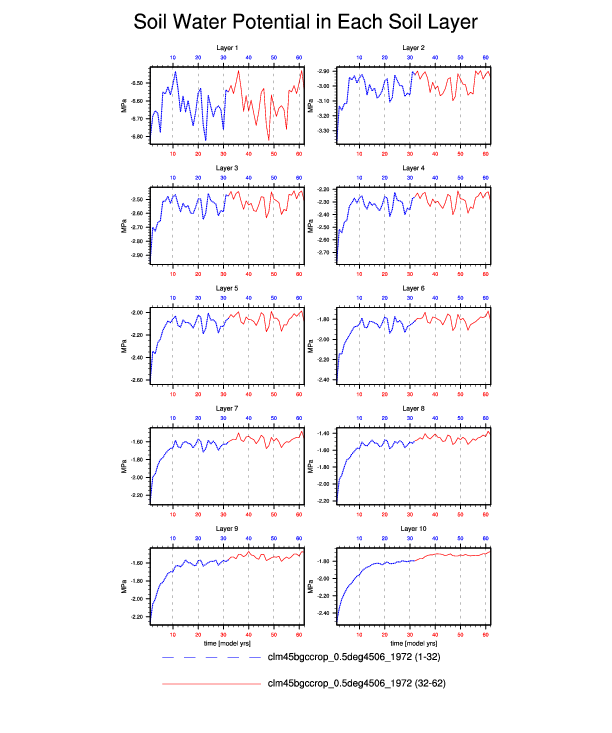
| Soil Water Potential in Each Soil Layer (SOILPSI) | plot | --- | |
| snow liquid water (SNOWLIQ) | plot | --- | |
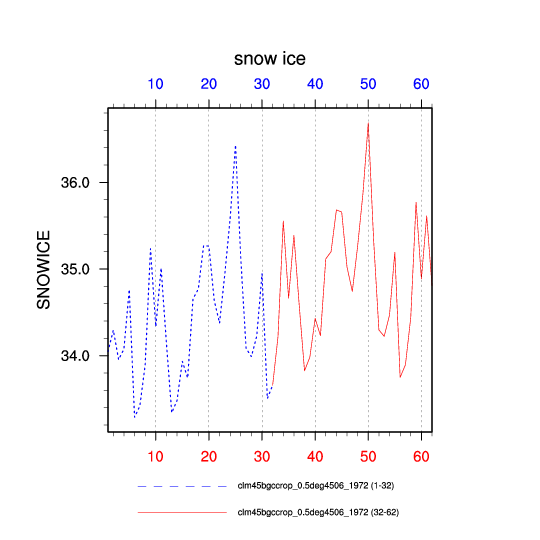
| snow ice (SNOWICE) | plot | --- | |
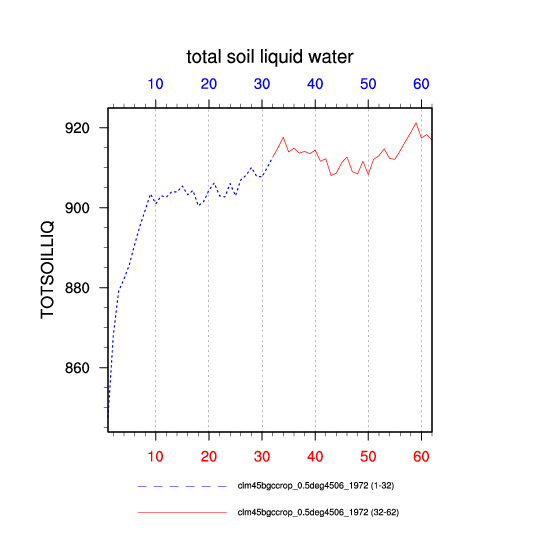
| total soil liquid water (TOTSOILLIQ) | plot | --- | |
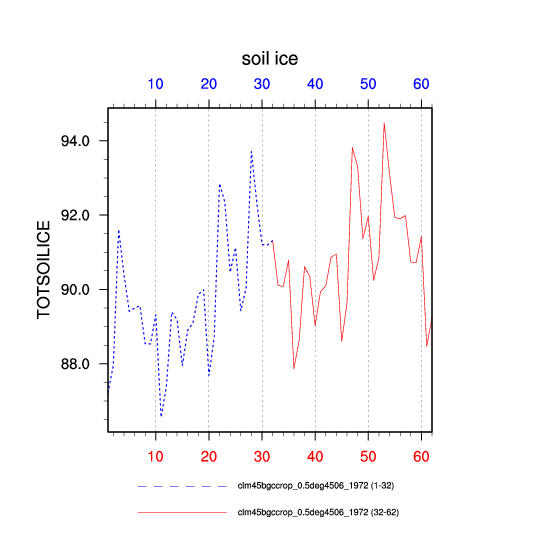
| soil ice (TOTSOILICE) | plot | --- | |
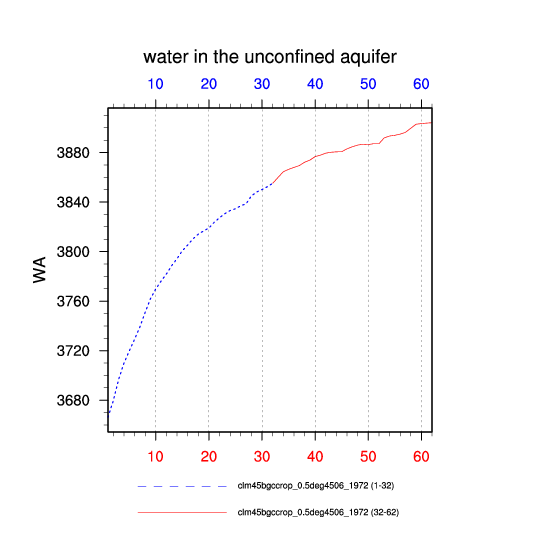
| water in the unconfined aquifer (WA) | plot | --- | |
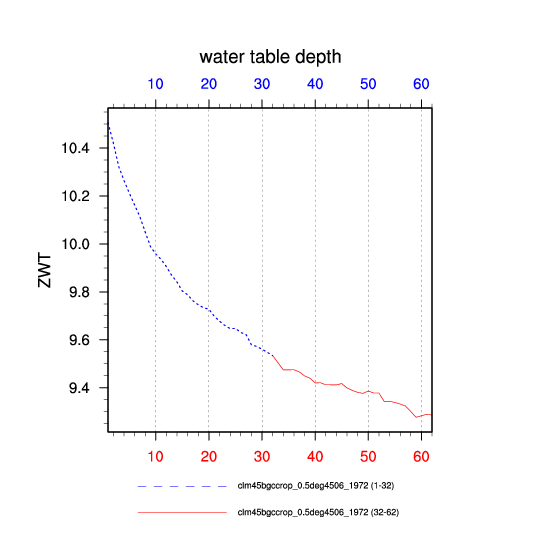
| water table depth (ZWT) | plot | --- | |
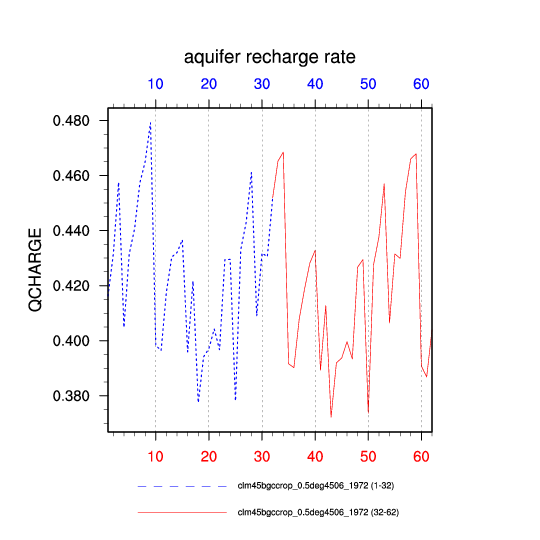
| aquifer recharge rate (QCHARGE) | plot | --- | |
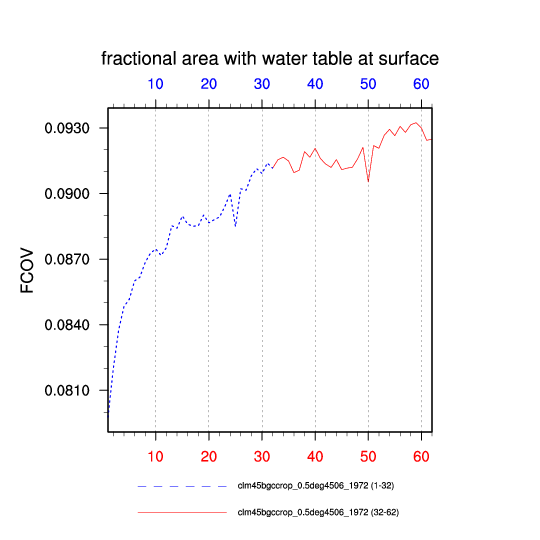
| fractional area with water table at surface (FCOV) | plot | --- | |
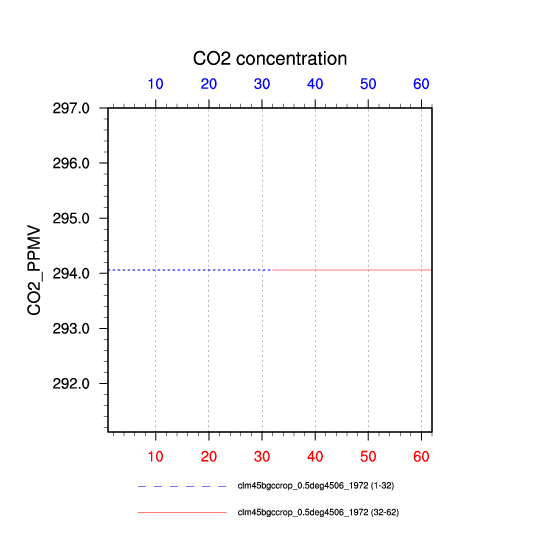
| CO2 concentration (CO2_PPMV) | plot | --- | |
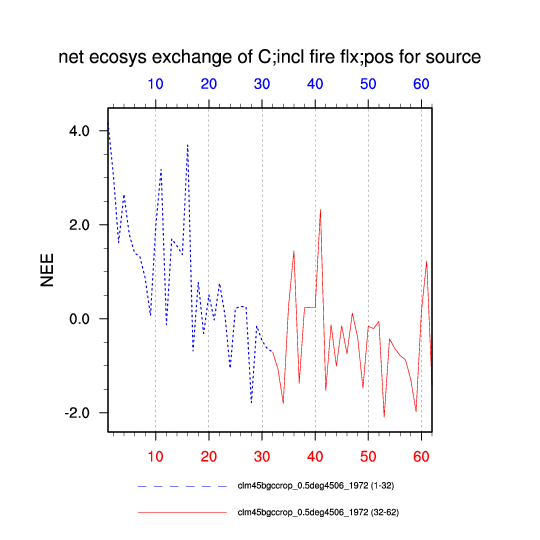
| net ecosys exchange of C;incl fire flx;pos for source (NEE) | plot | --- | |
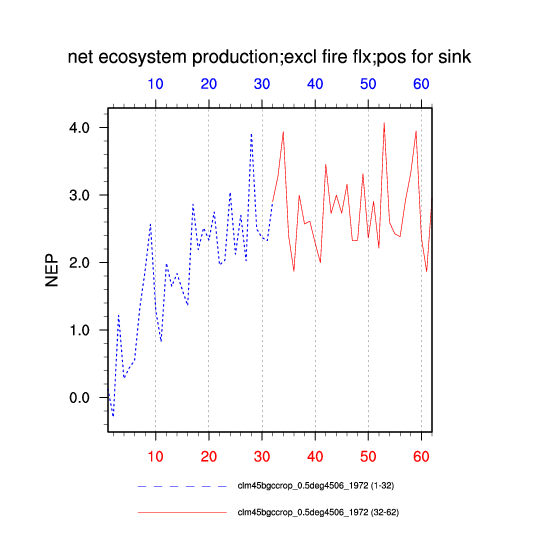
| net ecosystem production;excl fire flx;pos for sink (NEP) | plot | --- | |
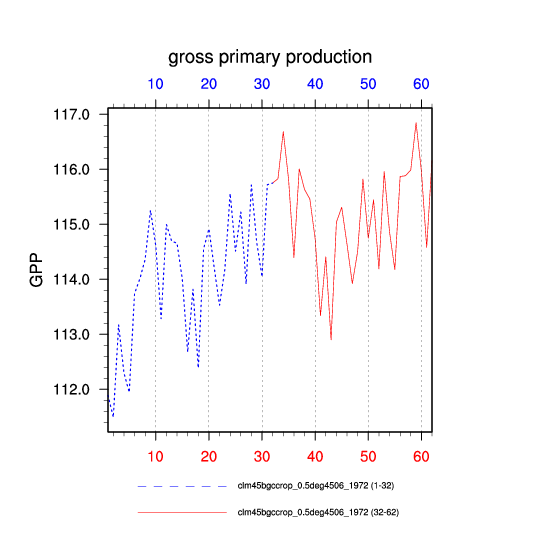
| gross primary production (GPP) | plot | --- | |
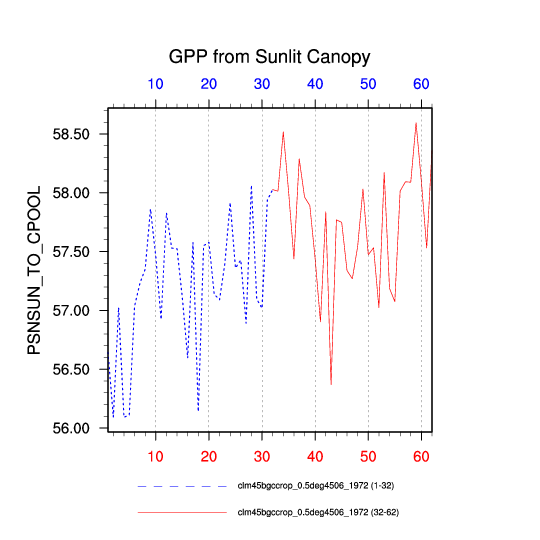
| GPP from Sunlit Canopy (PSNSUN_TO_CPOOL) | plot | --- | |
| GPP from Shaded Canopy (PSNSHADE_TO_CPOOL) | plot | --- | |
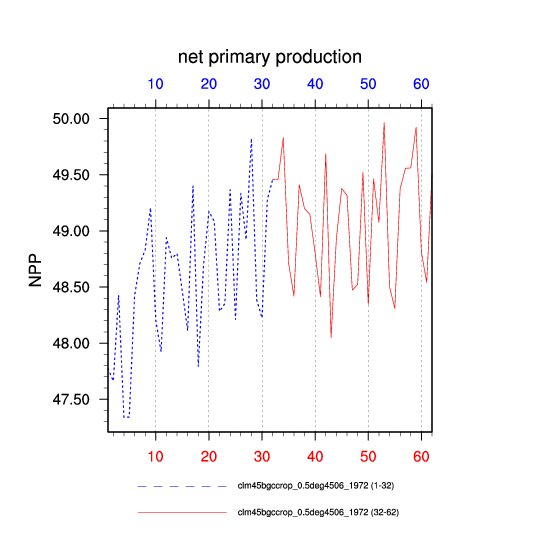
| net primary production (NPP) | plot | --- | |
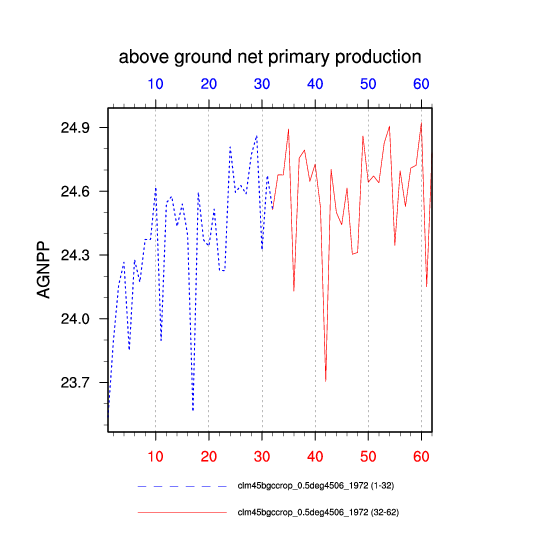
| above ground net primary production (AGNPP) | plot | --- | |
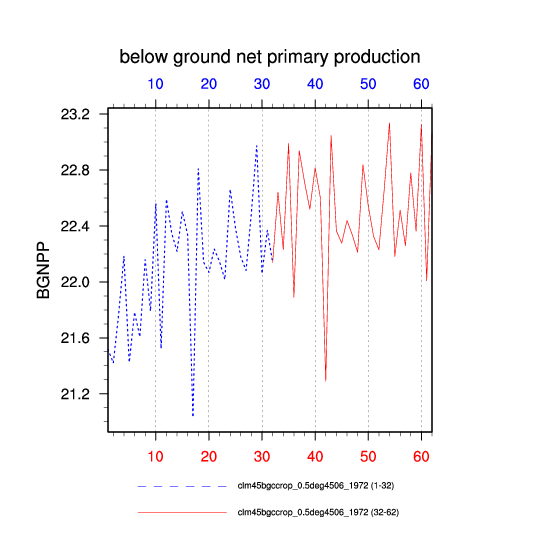
| below ground net primary production (BGNPP) | plot | --- | |
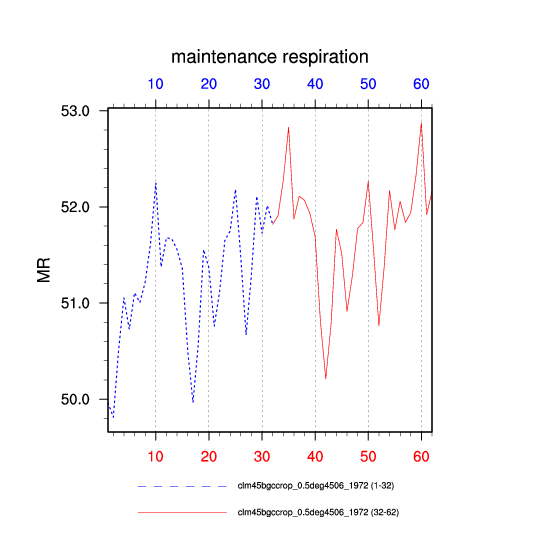
| maintenance respiration (MR) | plot | --- | |
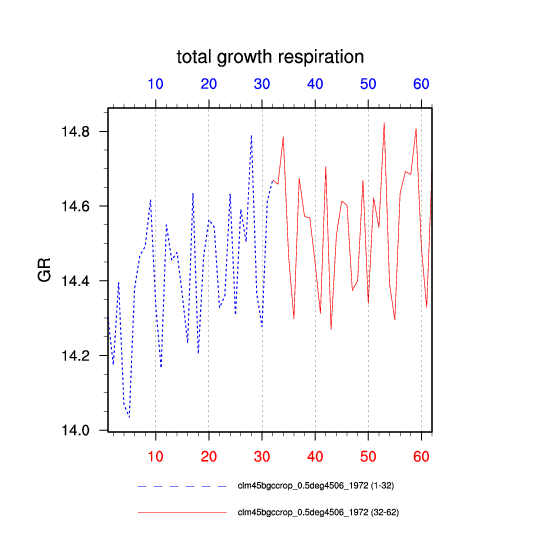
| total growth respiration (GR) | plot | --- | |
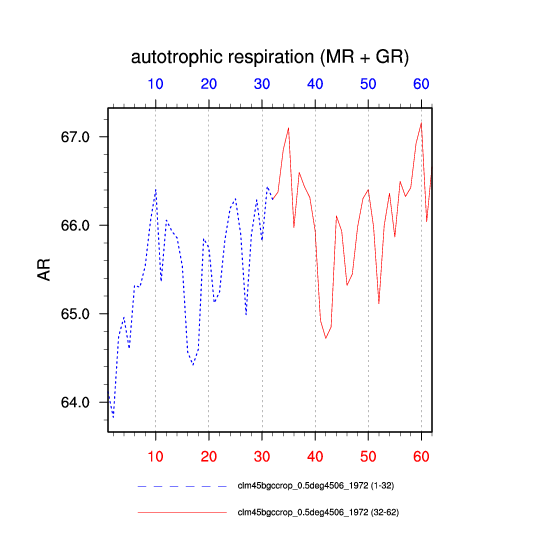
| autotrophic respiration (MR + GR) (AR) | plot | --- | |
| litter hetereotrophic respiration (LITHR) | plot | --- | |
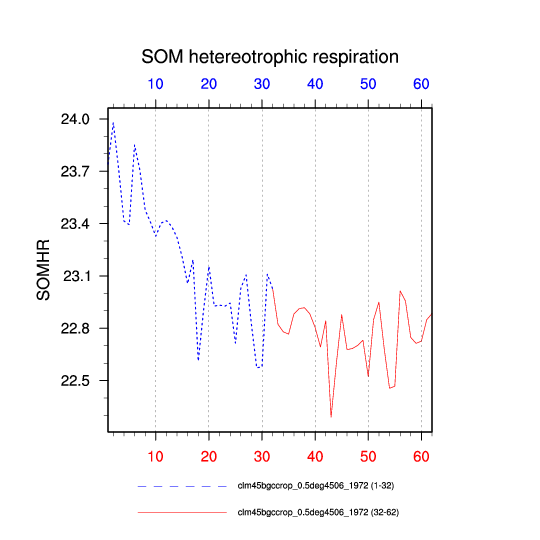
| SOM hetereotrophic respiration (SOMHR) | plot | --- | |
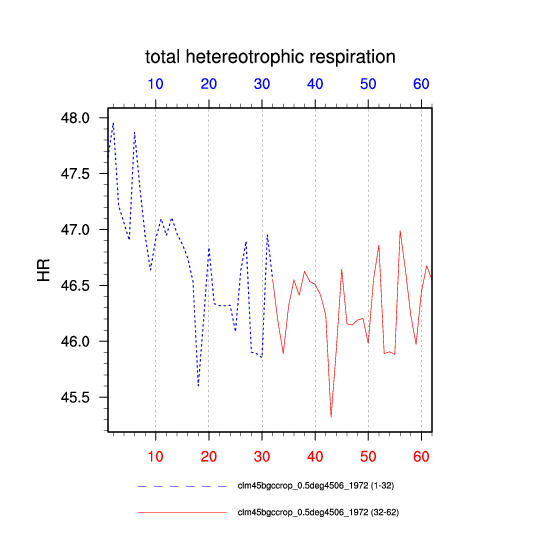
| total hetereotrophic respiration (HR) | plot | --- | |
| root respiration (fine root MR + total root GR) (RR) | plot | --- | |
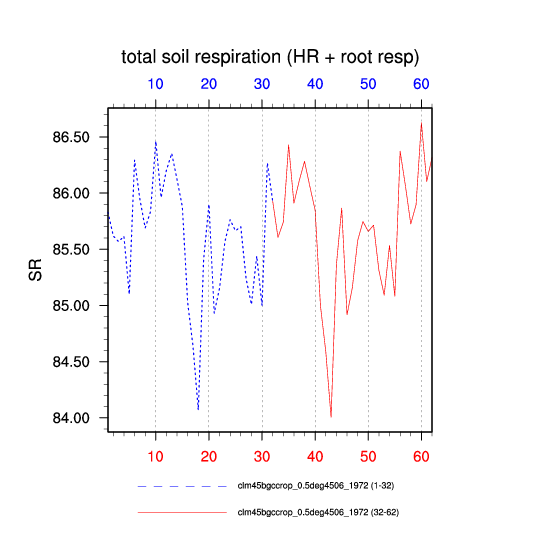
| total soil respiration (HR + root resp) (SR) | plot | --- | |
| total ecosystem respiration (AR + HR) (ER) | plot | --- | |
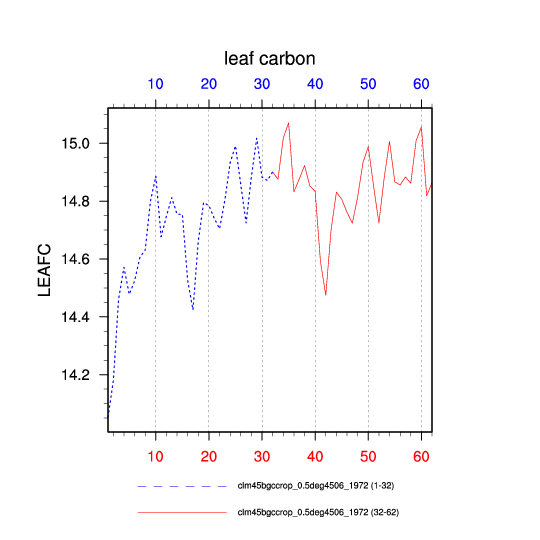
| leaf carbon (LEAFC) | plot | --- | |
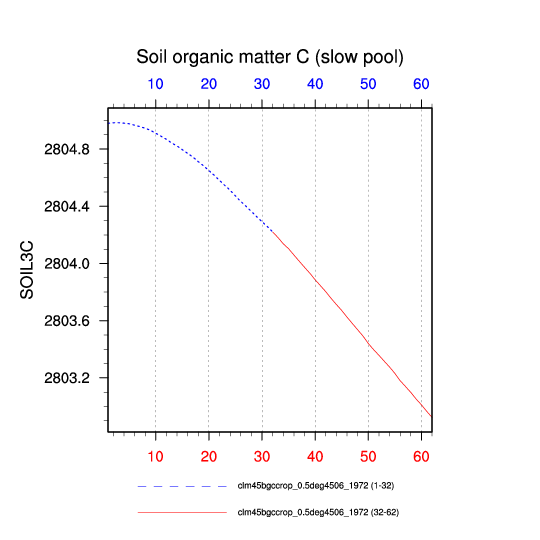
| Soil organic matter C (slow pool) (SOIL3C) | plot | --- | |
| Soil organic matter C (slowest pool) (SOIL4C) | --- | --- | |
| fine root carbon (FROOTC) | plot | --- | |
| live stem C (LIVESTEMC) | plot | --- | |
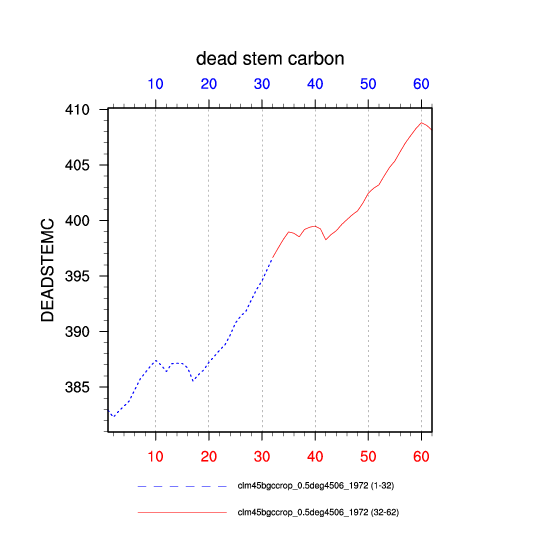
| dead stem carbon (DEADSTEMC) | plot | --- | |
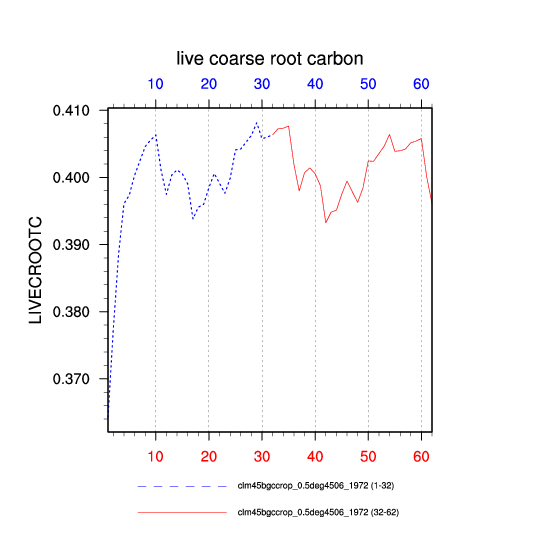
| live coarse root carbon (LIVECROOTC) | plot | --- | |
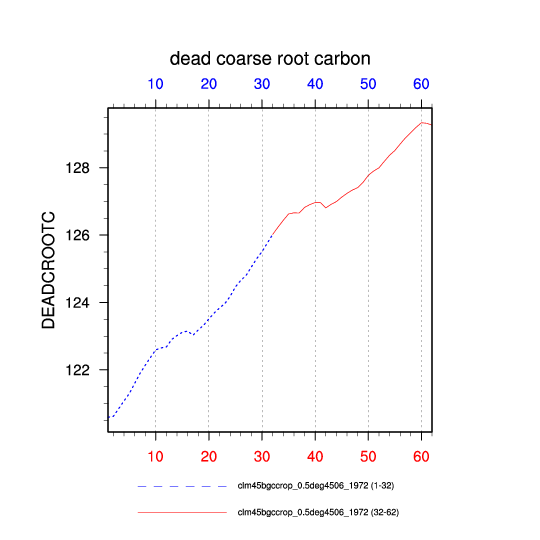
| dead coarse root carbon (DEADCROOTC) | plot | --- | |
| temporary photosynthate C pool (CPOOL) | plot | --- | |
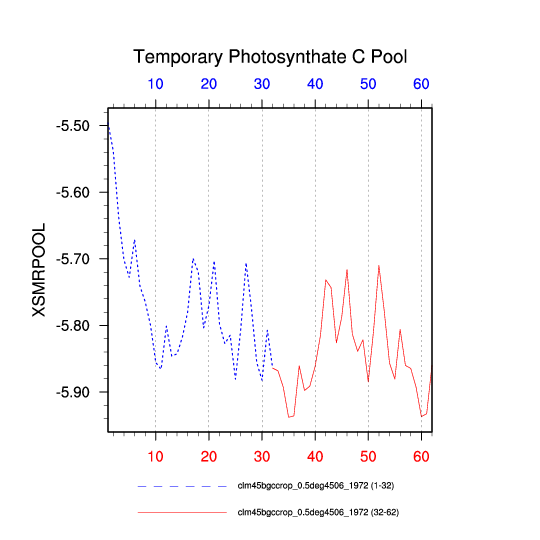
| Temporary Photosynthate C Pool (XSMRPOOL) | plot | --- | |
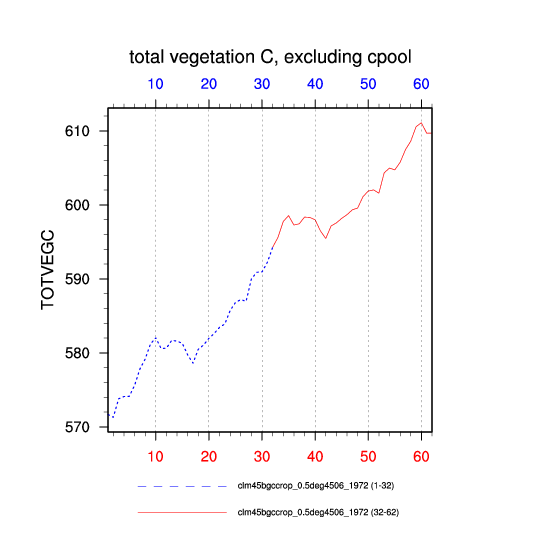
| total vegetation C, excluding cpool (TOTVEGC) | plot | --- | |
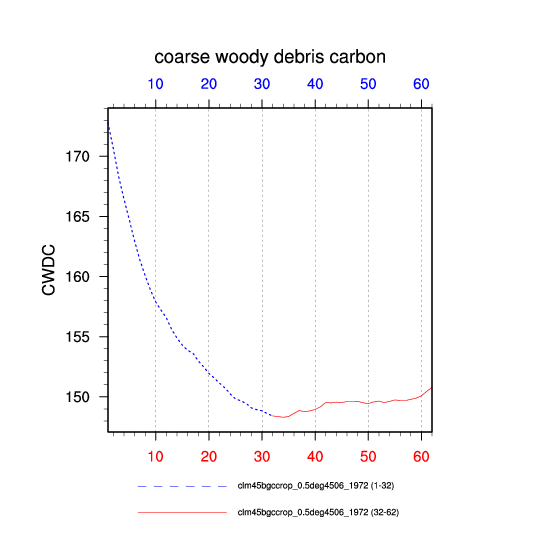
| coarse woody debris carbon (CWDC) | plot | --- | |
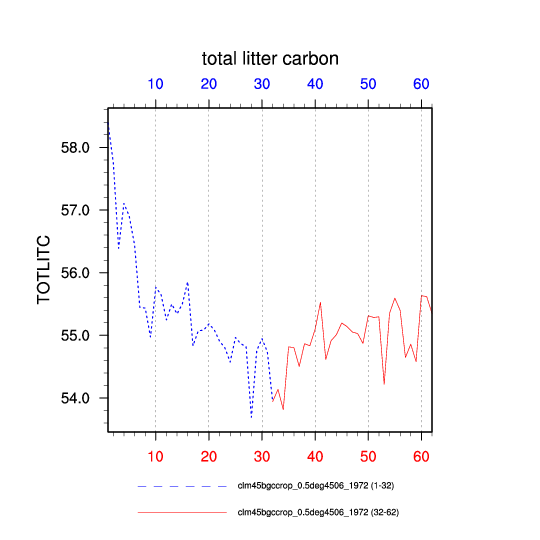
| total litter carbon (TOTLITC) | plot | --- | |
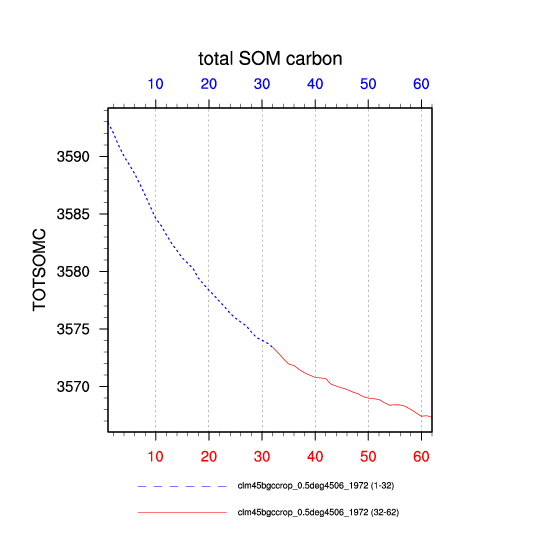
| total SOM carbon (TOTSOMC) | plot | --- | |
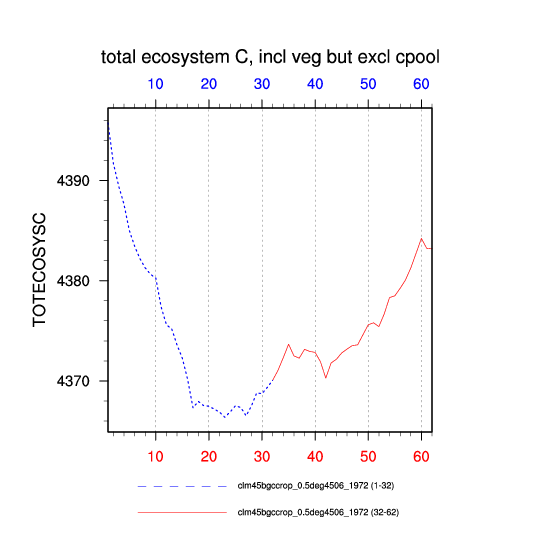
| total ecosystem C, incl veg but excl cpool (TOTECOSYSC) | plot | --- | |
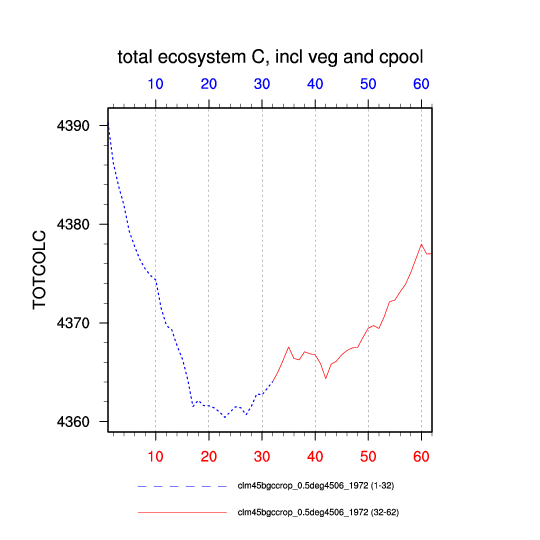
| total ecosystem C, incl veg and cpool (TOTCOLC) | plot | --- | |
| column-level sink for C truncation (COL_CTRUNC) | plot | --- | |
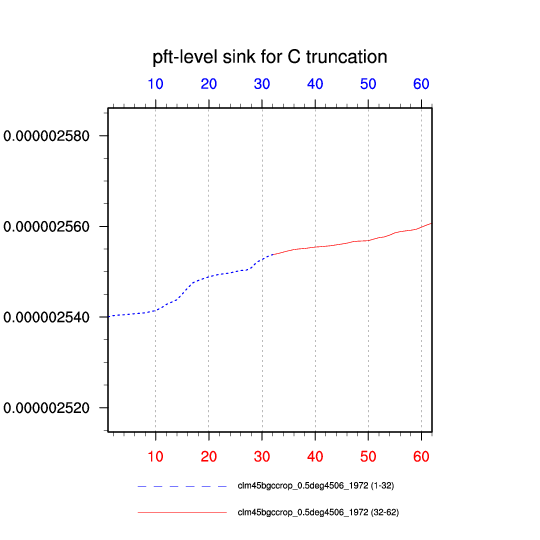
| pft-level sink for C truncation (PFT_CTRUNC) | plot | --- | |
| fraction of potential GPP (FPG) | plot | --- | |
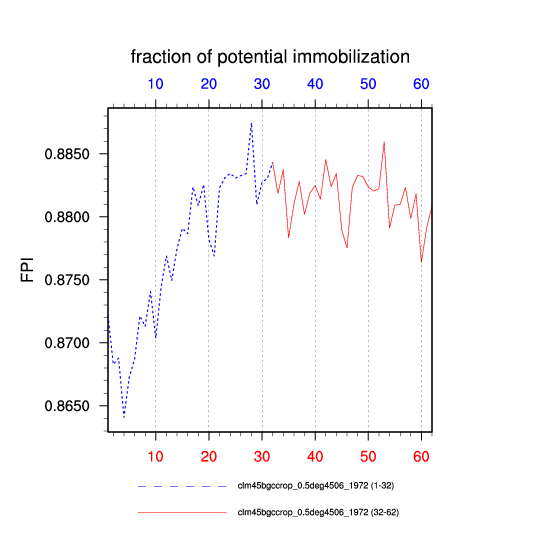
| fraction of potential immobilization (FPI) | plot | --- | |
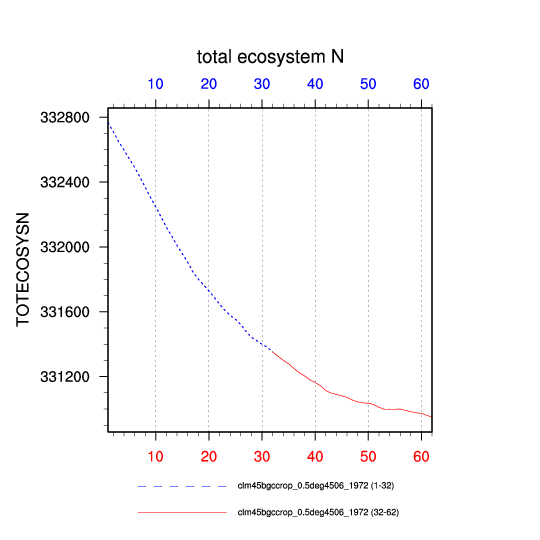
| total ecosystem N (TOTECOSYSN) | plot | --- | |
| nitrogen deposition (NDEP_TO_SMINN) | plot | --- | |
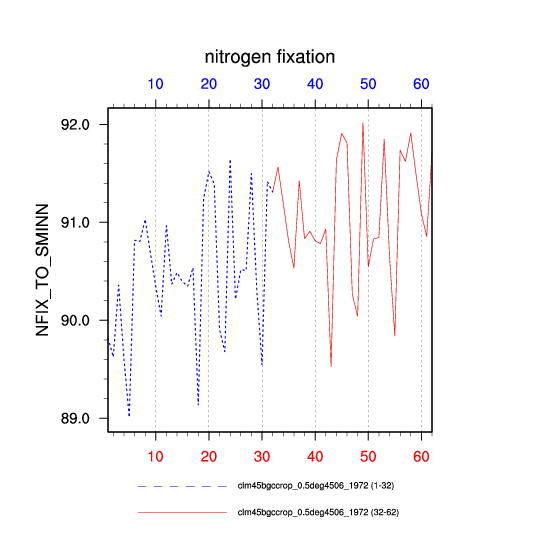
| nitrogen fixation (NFIX_TO_SMINN) | plot | --- | |
| supplement to mineral nitrogen (SUPPLEMENT_TO_SMINN) | plot | --- | |
| Nitrogen Leached (SMINN_LEACHED) | --- | --- | |
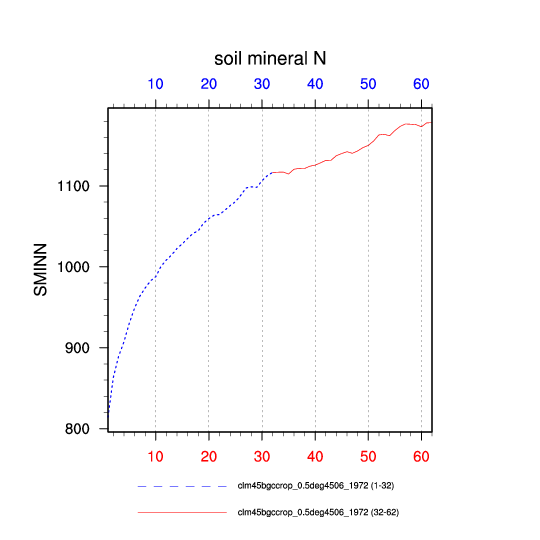
| soil mineral N (SMINN) | plot | --- | |
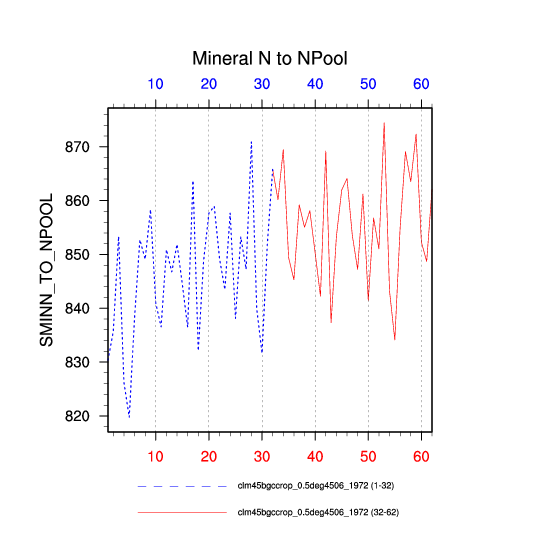
| Mineral N to NPool (SMINN_TO_NPOOL) | plot | --- | |
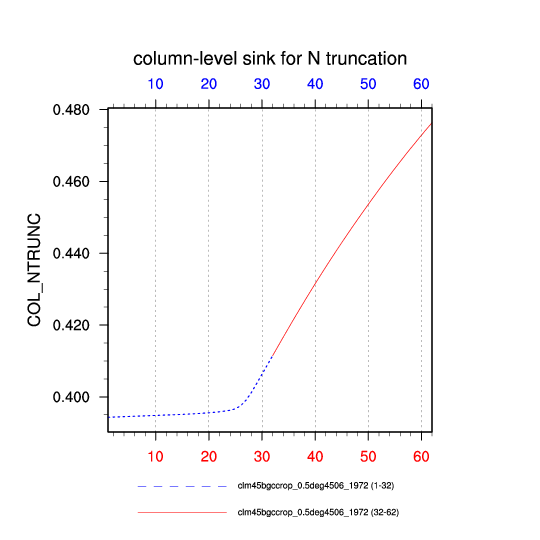
| column-level sink for N truncation (COL_NTRUNC) | plot | --- | |
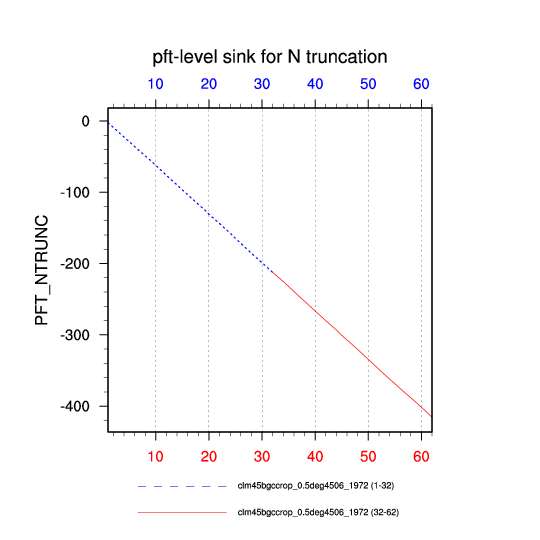
| pft-level sink for N truncation (PFT_NTRUNC) | plot | --- | |
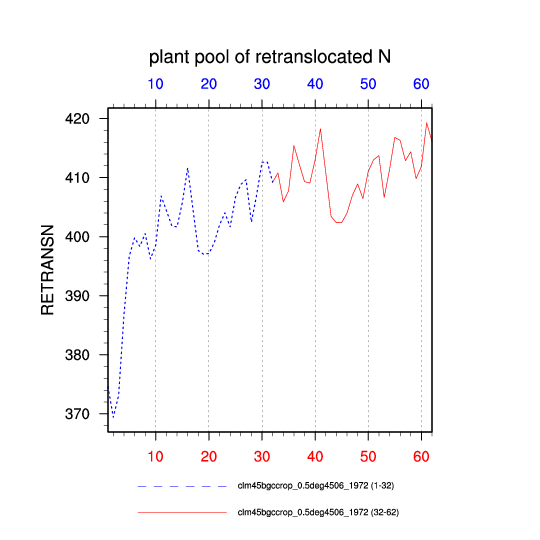
| plant pool of retranslocated N (RETRANSN) | plot | --- | |
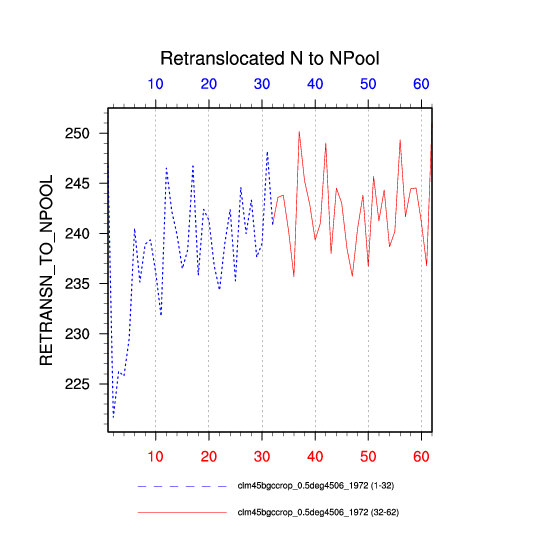
| Retranslocated N to NPool (RETRANSN_TO_NPOOL) | plot | --- | |
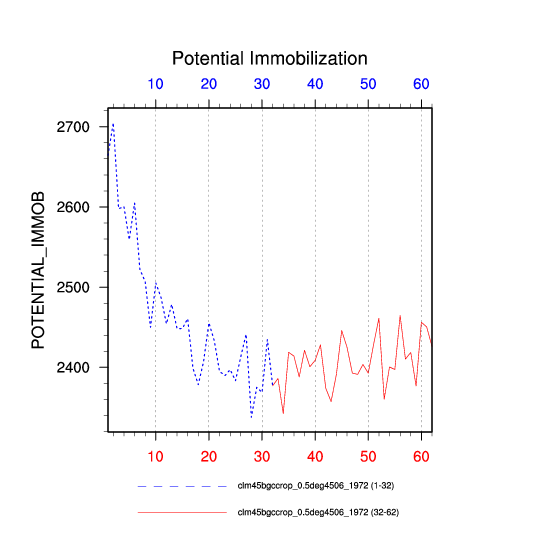
| Potential Immobilization (POTENTIAL_IMMOB) | plot | --- | |
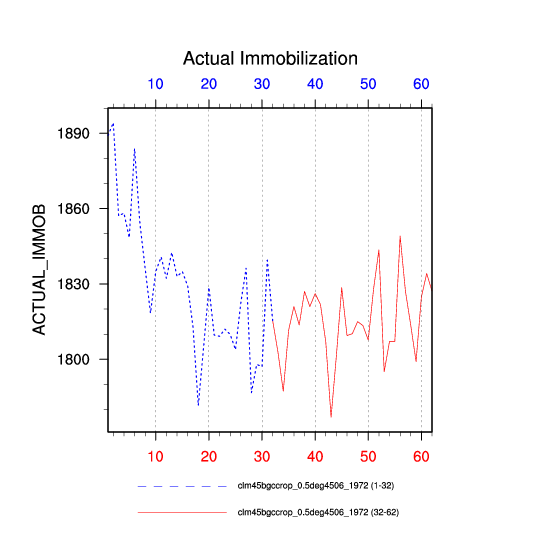
| Actual Immobilization (ACTUAL_IMMOB) | plot | --- | |
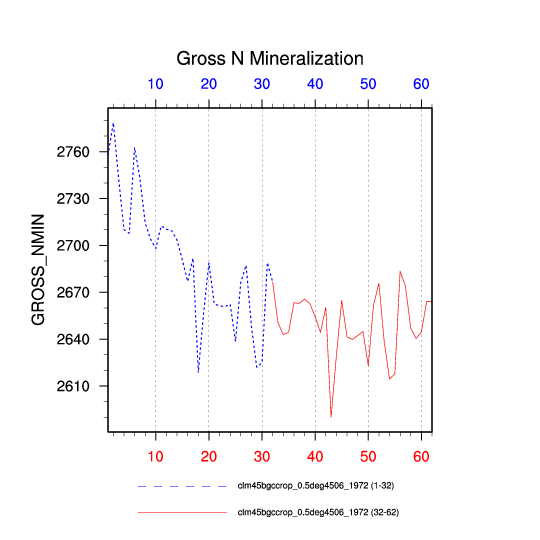
| Gross N Mineralization (GROSS_NMIN) | plot | --- | |
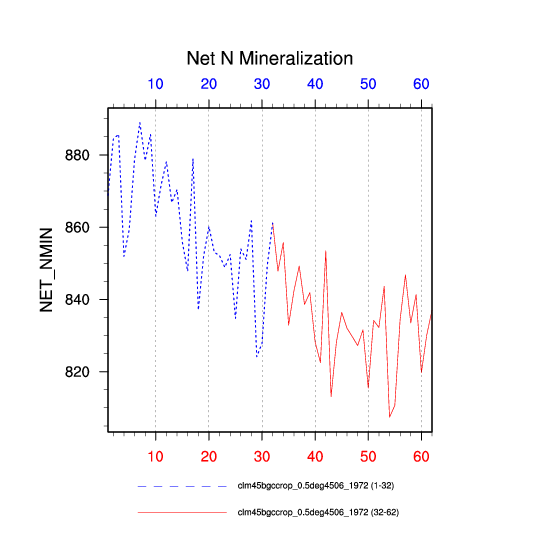
| Net N Mineralization (NET_NMIN) | plot | --- | |
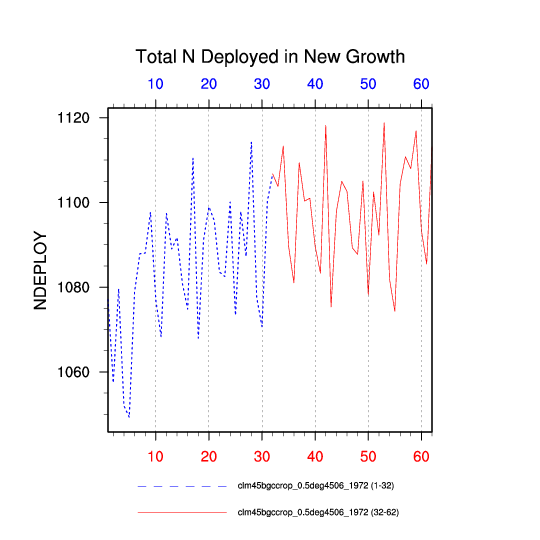
| Total N Deployed in New Growth (NDEPLOY) | plot | --- | |
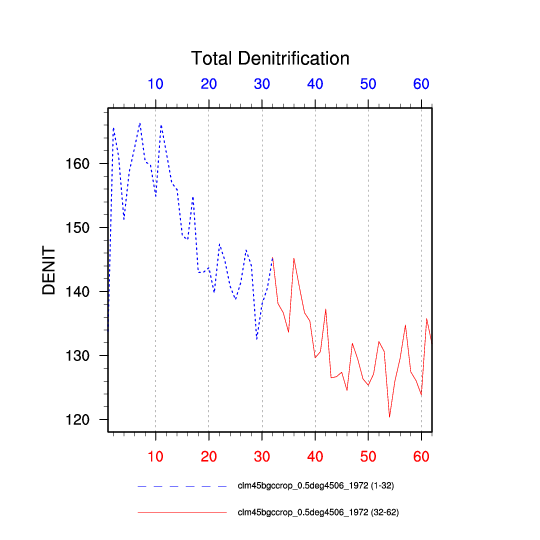
| Total Denitrification (DENIT) | plot | --- | |
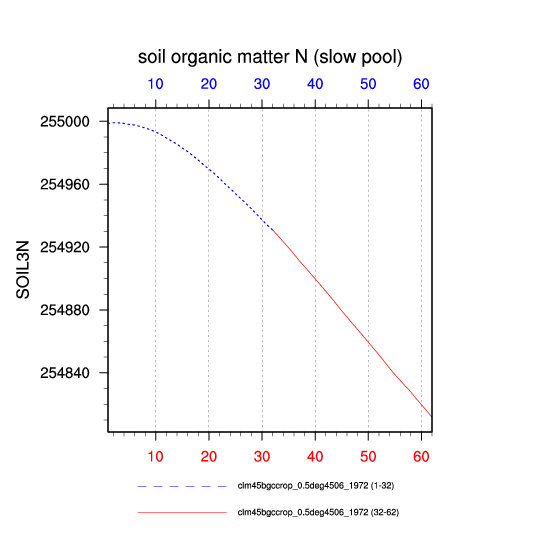
| soil organic matter N (slow pool) (SOIL3N) | plot | --- | |
| Soil organic matter N (slowest pool) (SOIL4N) | --- | --- | |
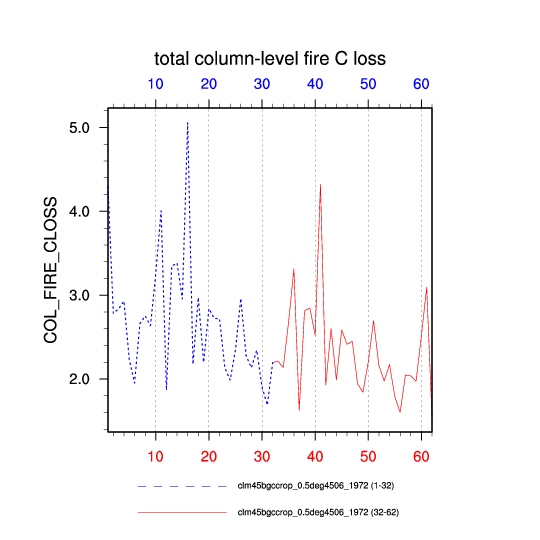
| total column-level fire C loss (COL_FIRE_CLOSS) | plot | --- | |
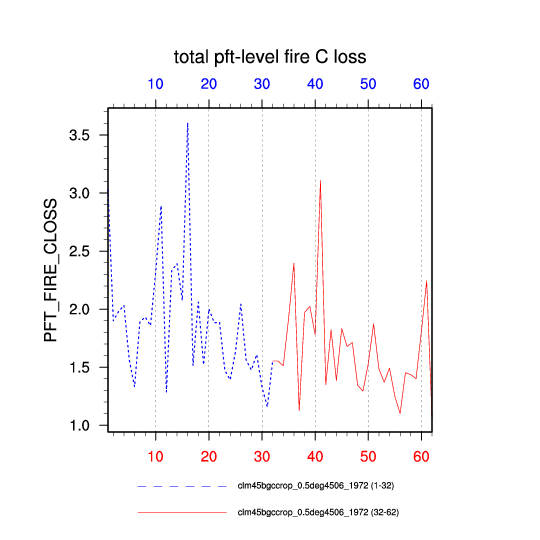
| total pft-level fire C loss (PFT_FIRE_CLOSS) | plot | --- | |
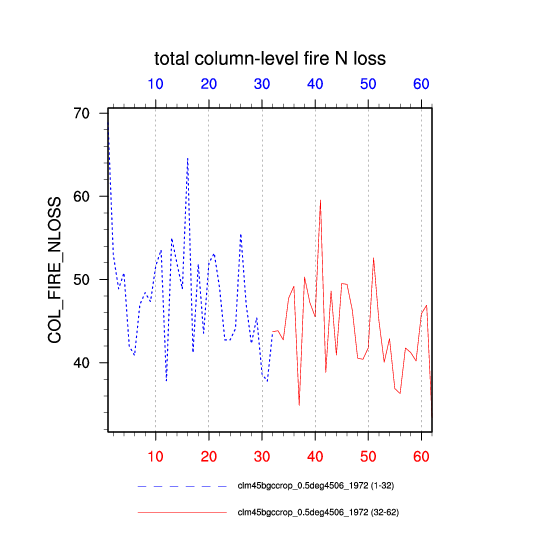
| total column-level fire N loss (COL_FIRE_NLOSS) | plot | --- | |
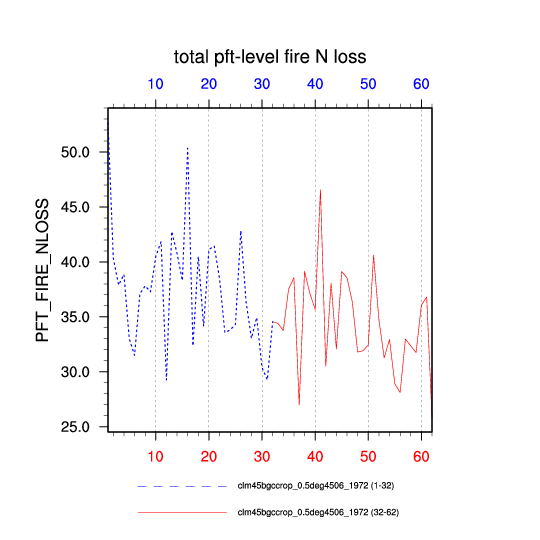
| total pft-level fire N loss (PFT_FIRE_NLOSS) | plot | --- | |
| annual fire season length (FIRESEASONL) | --- | --- | |
| annual total fractional area burned (ANN_FAREA_BURNED) | --- | --- | |
| e-folding mean of daily fire probability (MEAN_FIRE_PROB) | --- | --- | |
| Coarse Woody Debris C Hetereotrophic respiration (CWDC_HR) | plot | --- | |
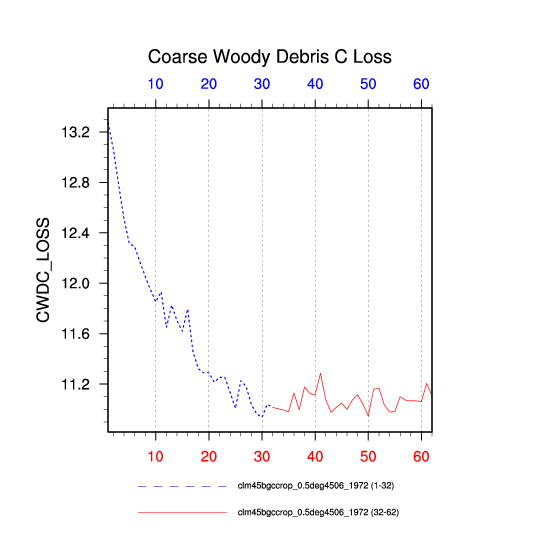
| Coarse Woody Debris C Loss (CWDC_LOSS) | plot | --- | |
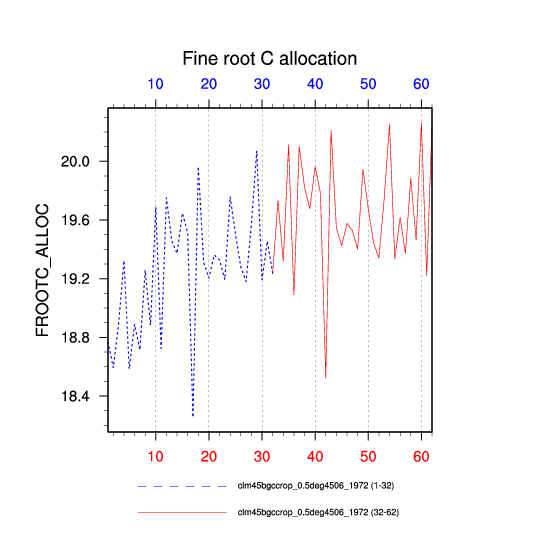
| Fine root C allocation (FROOTC_ALLOC) | plot | --- | |
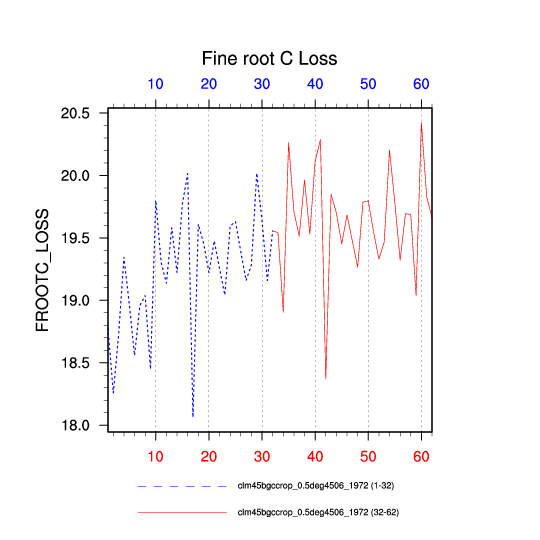
| Fine root C Loss (FROOTC_LOSS) | plot | --- | |
| Leaf C Allocation (LEAFC_ALLOC) | plot | --- | |
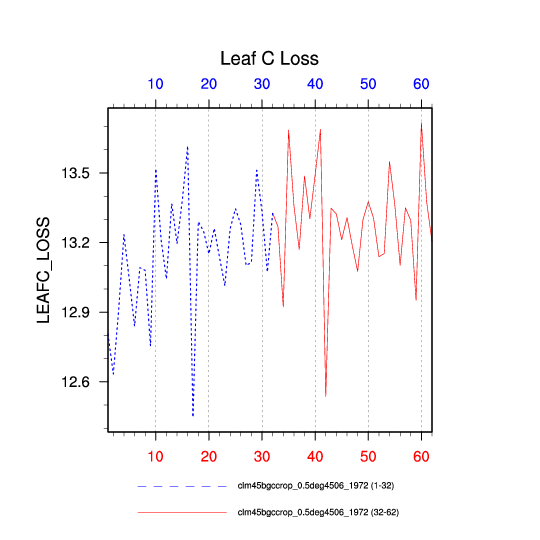
| Leaf C Loss (LEAFC_LOSS) | plot | --- | |
| Total Litter C (LITTERC) | plot | --- | |
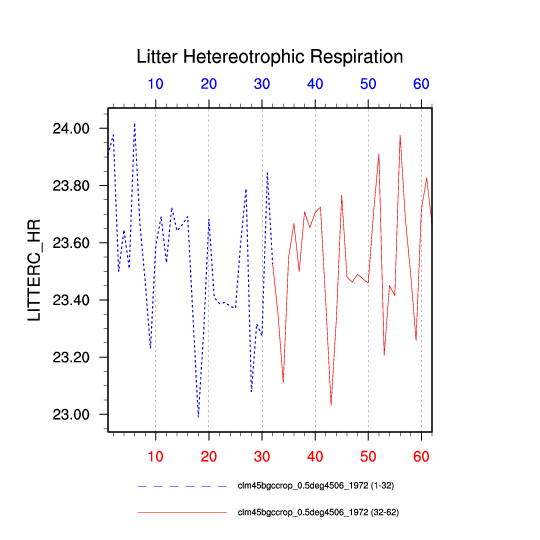
| Litter Hetereotrophic Respiration (LITTERC_HR) | plot | --- | |
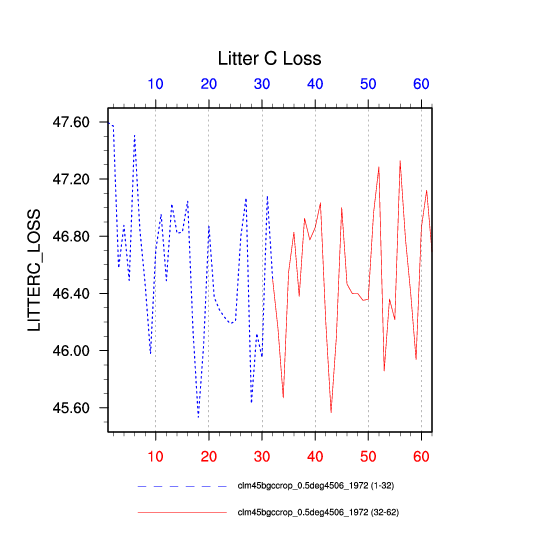
| Litter C Loss (LITTERC_LOSS) | plot | --- | |
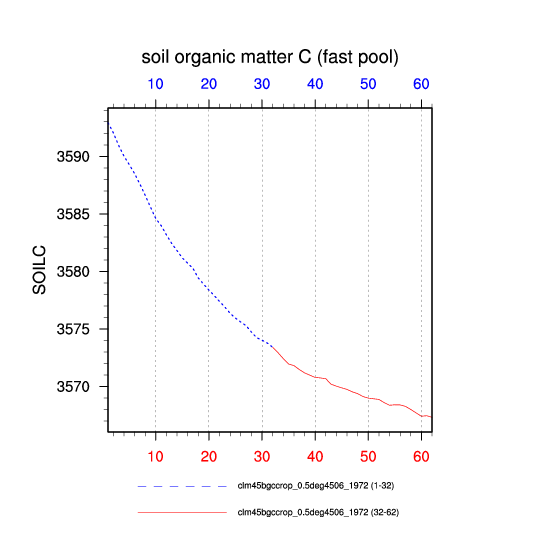
| soil organic matter C (fast pool) (SOILC) | plot | --- | |
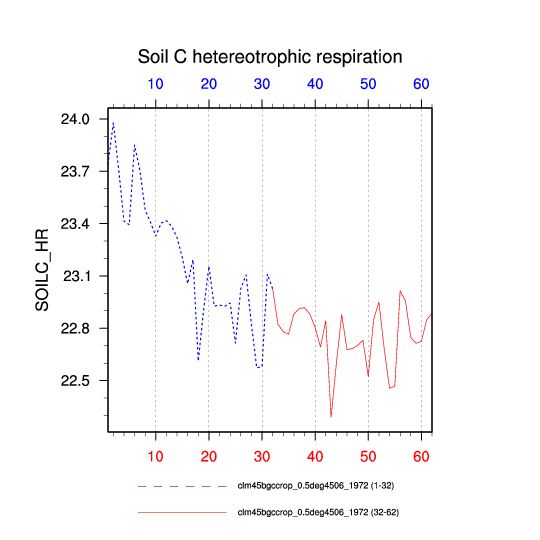
| Soil C hetereotrophic respiration (SOILC_HR) | plot | --- | |
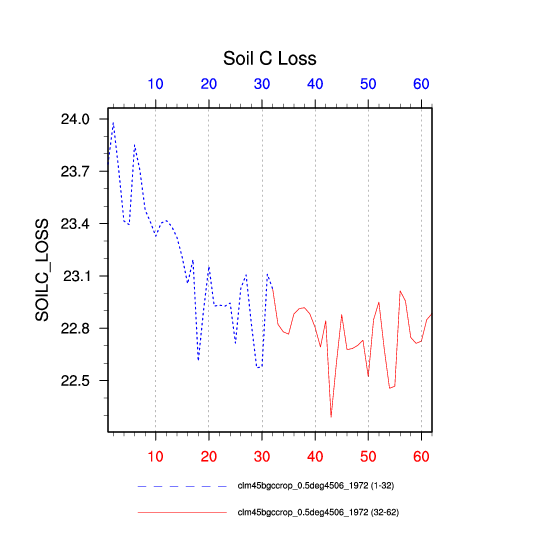
| Soil C Loss (SOILC_LOSS) | plot | --- | |
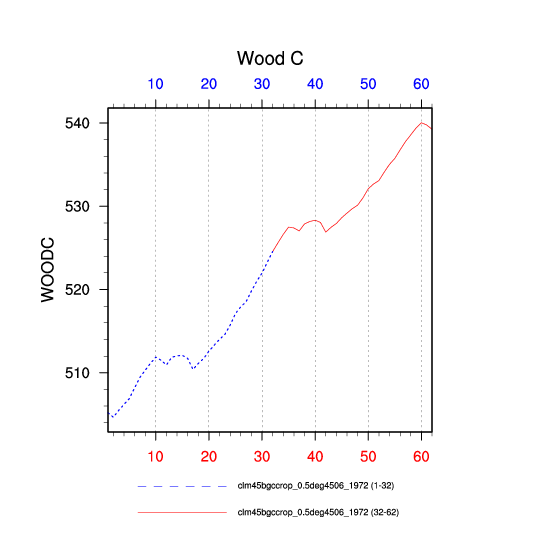
| Wood C (WOODC) | plot | --- | |
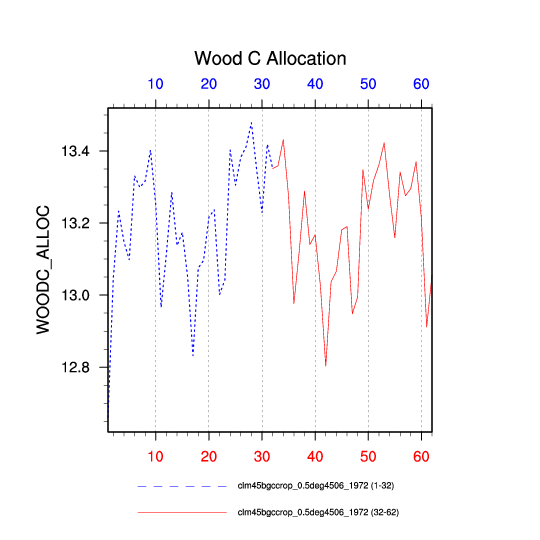
| Wood C Allocation (WOODC_ALLOC) | plot | --- | |
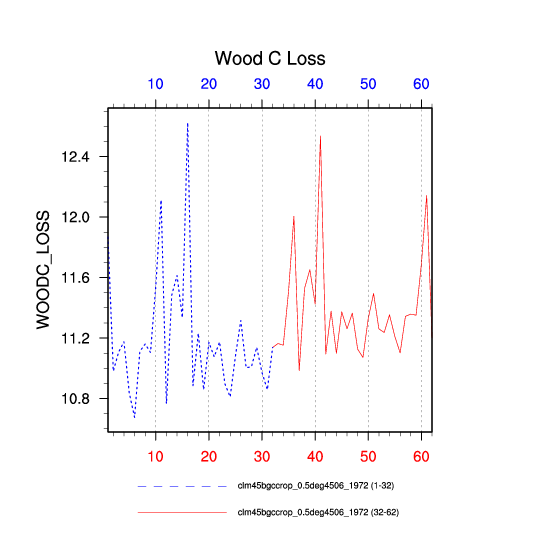
| Wood C Loss (WOODC_LOSS) | plot | --- | |