The Cooperative Agreement To Analyze variabiLity, change and predictabilitY in the earth SysTem (CATALYST) represents a sustained commitment by the Department of Energy (DOE) and the University Corporation for Atmospheric Research (UCAR) to perform foundational research toward advancing a robust understanding of modes of variability and change using models, observations and process studies.
Project Leadership
PI: Gerald A. Meehl [ meehl@ucar.edu ]
Co-PI: Jadwiga (Yaga) Richter [ jrichter@ucar.edu ]
Project Manager: Nan Rosenbloom [ nanr@ucar.edu ]
Research Objective (RO) Leads:
Administrative Support: Stephanie Shearer [ shearer@ucar.edu ]
Project Description
CATALYST performs foundational coordinated research in a team oriented, collaborative environment. It aims to advance a robust understanding of the modes of Earth system variability and change by utilizing the DOE Exascale Earth System Model (E3SM), the NCAR Community Earth System Model (CESM), Coupled Model Intercomparison Project (CMIP) multi-model data sets, a hierarchy of simpler models, machine learning methods, and numerous observational data sets.
CATALYST research is centered around modes of variability (MOV) on subseasonal to decadal timescales summarized in the figure below:
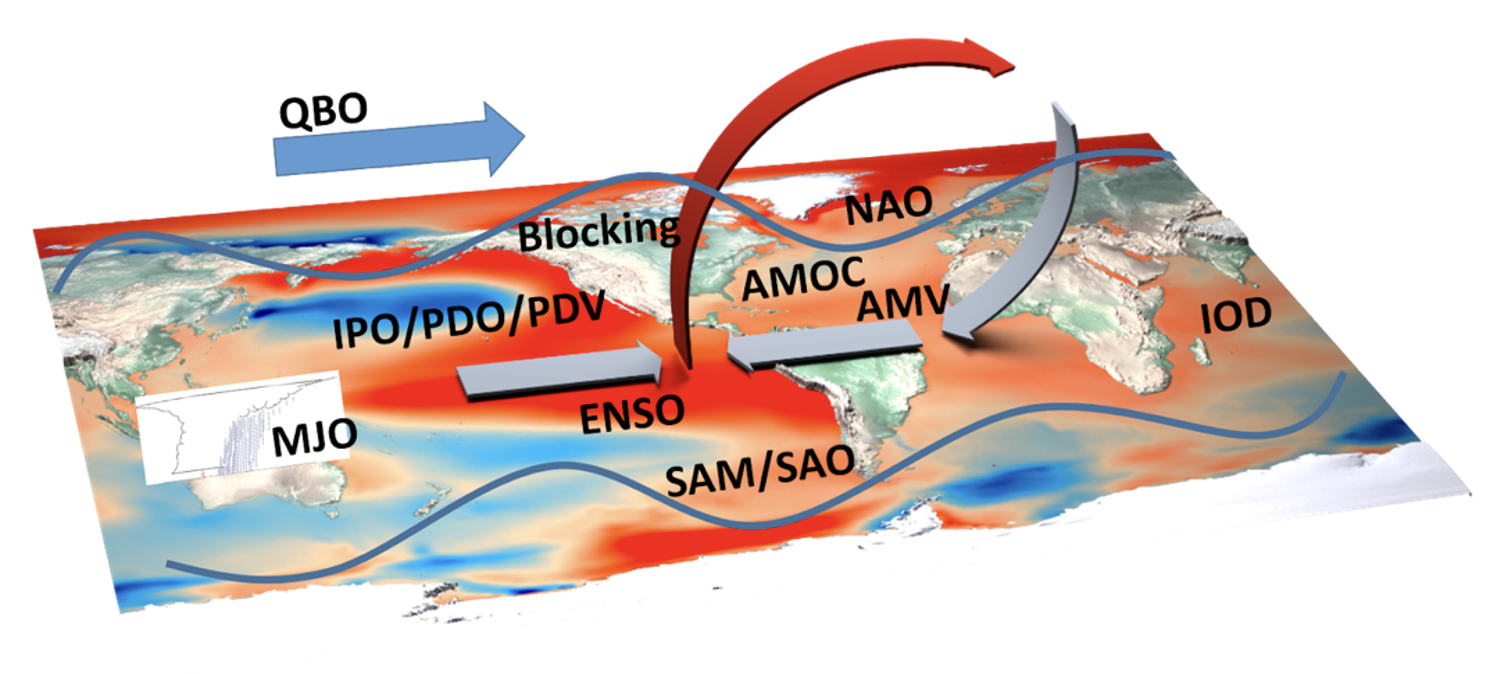
Modes of variability addressed by research tasks in CATALYST: MJO = Madden-Julian Oscillation; NAO = North Atlantic Oscillation (and the related Arctic Oscillation (AO) that is characterized by zonal wind and temperature variations across the mid-and high northern latitudes); ENSO = El Niño/Southern Oscillation; IPO/PDO/PDV = Interdecadal Pacific Oscillation/Pacific Decadal Oscillation/Pacific Decadal Variability (used interchangeably in the literature); QBO = Quasi-Biennial Oscillation; IOD = Indian Ocean Dipole; SAM/SAO = Southern Annular Mode/Semi-Annual Oscillation; AMV= Atlantic Multidecadal Variability (also known as Atlantic Multi- decadal Oscillation, AMO); AMOC = Atlantic Meridional Overturning Circulation; blocking = long-lived areas of high atmospheric pressure. Sea-surface temperature (SST) anomaly pattern in schematic represents the positive phase of IPO/PDO/PDV with connections through the atmospheric Walker Circulation to the Atlantic.
2021 - 2024 Research
CATALYST research consists of four primary research objectives that are closely interrelated.
RO1: Predictability and Prediction
RO1 addresses the limits of predictability of modes of variability on subseasonal-to-decadal timescales using E3SM, CESM, and machine learning methods. Specific research tasks include:
- Use initialized reforecasts with CESM and E3SM to understand the sources of predictability of key modes of variability (MJO, ENSO, PDV, AMV)
- Use machine learning methods to increase the limits of predictability on subseasonal to decadal timescales
- Understand the relationship between AMOC and predictability of MOV (AMV, PDV)
RO2: Interactions & Sensitivity
RO2 uses a hierarchy of models to inform predictions, and it addresses relevant processes and feedbacks related to modes of variability and how they interact with each other. Specific key research tasks include:
- Quantify the interactions between the QBO and the MJO
- Identify interactions between MJO and ENSO
- Examine teleconnections among ENSO, SAO, SAM, and IPO
RO3: Benchmarking, External Forcing & Tipping Points
RO3 benchmarks model representations of modes of variability in Earth system models, examines the role of external forcing in changes of modes of variability and their interactions, and addresses the likelihood and predictability of tipping points and irreversible changes. Specific key research tasks include:
- Benchmark modes of variability and climate states in the E3SM, CESM, and other climate models.
- Quantify the role of external forcing in driving changes in modes of variability in E3SM and CESM using large- and single-forcing ensembles.
- Quantify the couplings between modes of variability in E3SM and CESM and tipping points in the climate system.
RO4: High-Impact Events
RO4 investigates the relationships between the modes of variability addressed in the other research objectives and high-impact events—such as flash droughts and precipitation extremes, atmospheric rivers, tropical cyclones—and how these might change in future climate through model analyses, process studies, and innovative application of machine learning methodologies. Specific key research tasks include:
- Using machine learning and artificial intelligence methods, identify what types of synoptic weather features produce extreme precipitation, and quantify how those synoptic features are affected by modes of variability and possible future changes.
- Examine connections between modes of variability and atmospheric rivers.
- Quantify linkages between modes of variability and tropical cyclones.
- Connect modes of variability with precipitation extremes.
Science Highlights
Atmospheric River Tracking Method Intercomparison Project (ARTMIP): Project Goals and Experimental Design
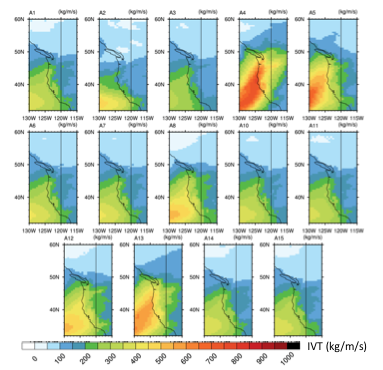
Composite MERRA-2 integrated vapor transport (IVT, kg m-1s-1) for landfalling ARs along the North American west coast using 14 different algorithms. Time instances where an AR was detected along the coastline were composited for the entire region. Composite data is plotted for February 2017. To test the ARTMIP framework, a 1-month proof-of-concept trial was designed and performed for February 2017. This month was chosen due to large number of landfalling ARs that impacted western North America during this period. This example illustrates differences in tracking methodologies.
Objective
- Provide motivation for the ARTMIP project whose sponsors include NCAR and the Department of Energy Regional and Global Model Analysis component of the Earth and Environmental System Modeling Program
- Outline goals of ARTMIP: to quantify the uncertainty in AR climatology (e.g., frequency, duration, and intensity), precipitation, and related impacts that arises because of different AR tracking methods, and uncertainty in how these AR-related metrics may change in the future. The ARTMIP also aims to provide guidance regarding the advantages and disadvantages of different AR tracking methods, and which of these methods are best suited to answer certain scientific questions. Finally, the ARTMIP will develop an online repository of data for future use in research.
- Describe experimental design and timeline
- Present preliminary results using the key metrics of frequency, intensity, duration, and precipitation attribution.
Approach
- ARTMIP will proceed in a phased approach, Tier 1 and Tier 2, with different science objectives.
- All ARTMIP algorithm developers will run their respective algorithms on a common dataset (or datasets) and create catalogues where ARs are identified in time and space.
- Tier 1 is mandatory for all developers and will use MERRA-2 reanalysis from 1980-2017.
- Tier 2 will be divided into subtopics including climate change (model output) and reanalysis sensitivity.
A variety of precipitation datasets will also be used to assess uncertainties in AR impacts.
Impact
- The ARTMIP project has been positively received by the AR community and has the potential to shape much how AR science and detection is conducted. This paper describes the experimental design and invites further participation. The project has steadily increased participation since the paper was first presented in the open-forum GMD-Discussions.
- Preliminary results suggest that the diversity in algorithms does significantly impact how the community describes intensity, frequency, duration, and precipitation attribution. There is potentially more agreement in metrics for latitude of landfall.
Reference
Shields, C.A., et al., 2018: Atmospheric River Tracking Method Intercomparison Project (ARTMIP): Project Goals and Experimental Design, Geosci. Model Dev., https://doi.org/10.5194/gmd-11-2455-2018
Precipitation variability increases in a warmer climate
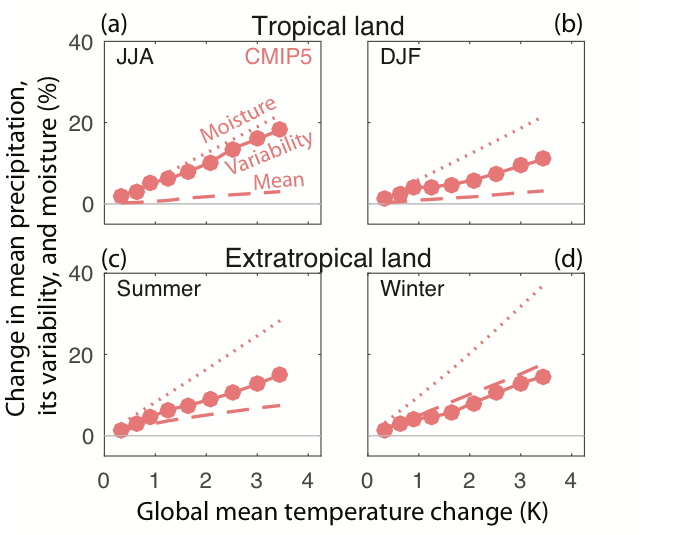
Percent change in variability with warming. Change in seasonal mean (dashed lines), standard deviation (solid lines), and moisture (dotted lines) averaged over extra-tropical land in (a) summer and (b) winter, and tropical land in (c) JJA and (d) DJF as a function of global-mean surface temperature for the CMIP5 multi-model mean. Each marker indicates a 30-year period centered on consecutive decades between 2006 and 2086 relative to the 1976–2005 base period.
Objective
- Quantify changes in precipitation variability and place them in the context of changes in mean and extreme precipitation and temperature variability.
Approach
- Analyze in model simulations of varying climate: the CMIP5 multi-model ensemble, as well as the CESM1 and GFDL single model ensembles, assessing variability across a range of timescales. Additionally, compare with daily precipitation variability from station observations.
Impact
- We find that precipitation variability in most climate models increases over a majority of global land area in response to warming (66% of land has a robust increase in variability of seasonal-mean precipitation). Global, multi-model mean, precipitation variability increases 3–4% K−1 globally, 4–5% K−1 over land and 2–4% K−1 over ocean, and is remarkably robust on a range of timescales from daily to decadal. Precipitation variability increases by at least as much as mean precipitation and less than moisture and extreme precipitation for most models, regions, and timescales. We interpret this as being related to an increase in moisture which is partially mitigated by weakening circulation. We show that changes in observed daily variability in station data are consistent with increased variability.
Reference
Pendergrass, A.G., R. Knutti, F. Lehner, C. Deser, and B.M. Sanderson, 2017: Scientific Reports, DOI:10.1038/s41598-017-17966-y
Future heat waves and extreme surface ozone events
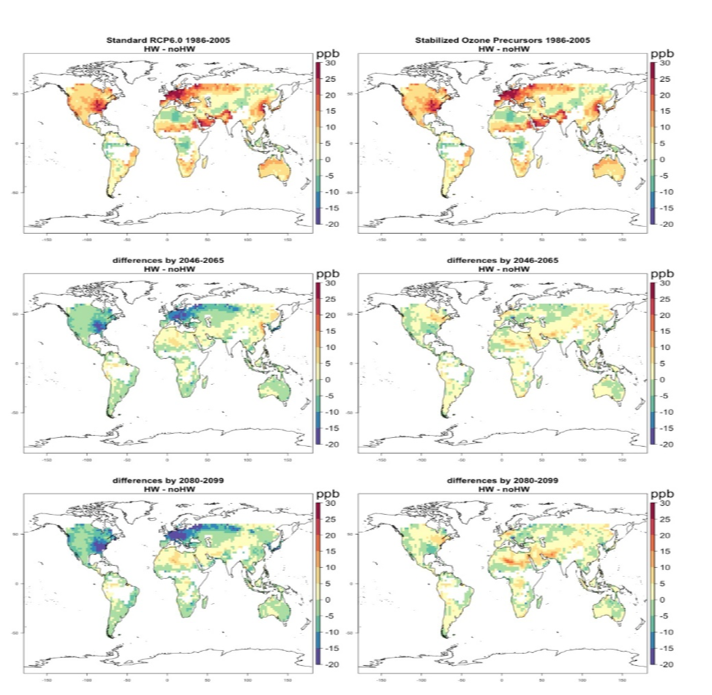
Top panels: Orange and red areas denote higher ozone during present-day heat waves in the model as observed; Panels at lower left: green and blue colors show decreases of ozone during future more intense heat waves in middle and late century due to the prescribed decreases in ozone precursors in RCP6.0, yellow denotes higher ozone in heat waves where there are prescribed increases of ozone precursors; Panels at lower right: Orange and yellow areas are where ozone increases in future more intense heat waves with stabilized ozone precursors, green areas are where ozone decreases in future intense heat waves mainly due to ozone suppression likely related to changes in isoprene emissions from forests.
Objective
- Understand how more intense heat waves in the future could affect severe surface ozone events, known to be harmful to human health.
Approach
- Analyze a global Earth system model that satisfactorily simulates the observed relationship between heat waves and elevated surface ozone levels.
- The model is either driven by emissions of greenhouse gases and ozone precursors from a medium-high emission scenario, RCP6.0, under which ozone precursors are assumed to decrease over time, in line with the assumption that better air quality measures will be put in place in the future; or by a modified RCP6.0 with anthropogenic ozone precursors fixed at 2005 levels.
Impact
- Ozone concentrations during future more intense heat waves decrease in areas where ozone precursors are prescribed to decrease in RCP6.0 (e.g. most of North America and Europe), while they increase in areas where ozone precursors either increase or have little change (e.g. central Asia, the Mideast, northern Africa). With stabilized ozone precursors, surface ozone concentrations increase during future heat waves compared to non-heat wave days in most regions except where ozone suppression takes place, likely from changes in isoprene emissions at high temperatures from forests. This study illustrates that temperature is not necessarily a primary control on modelled ozone concentrations in future heat waves. Dependence on ozone precursor emissions and suppression at high temperatures remain significant factors even in a warmer climate.
Reference
Meehl, G.A., C. Tebaldi, S. Tilmes, J.-F. Lamarque, S. Bates, A. Pendergrass, and D. Lombardozzi, 2018: Future heat waves and surface ozone.Env. Res. Lett.,DOI: 10.1088/1748-9326/aabcdc