CT-ROMS Results
Results
-
Download View Sea surface temperature (SST) animation: weekly SST from CT-ROMS compared to CoRTAD SST for the years 2004-2006
-
Download View Sea surface temperature (SST) animation: daily SST from CT-ROMS for the years 2004-2006
-
Download View Degree heating weeks (DHW) animation method #1: weekly DHW from CT-ROMS for the years 1960-2005. DHW is a measure of heat stress and is calculated as the sum of excess temperature above a designated threshold. The threshold was calculated for each grid point as 1 °C above the mean monthly maximum SST at that gridpoint.
-
Download View Degree heating weeks (DHW) animation method #2: weekly DHW from CT-ROMS for the years 1960-2005. The threshold was calculated for each grid point as 2 standard deviations above the mean monthly maximum SST at that gridpoint.
-
Download View Sea surface salinity (SSS) animation: daily SSS from CT-ROMS for the years 2004-2006.
-
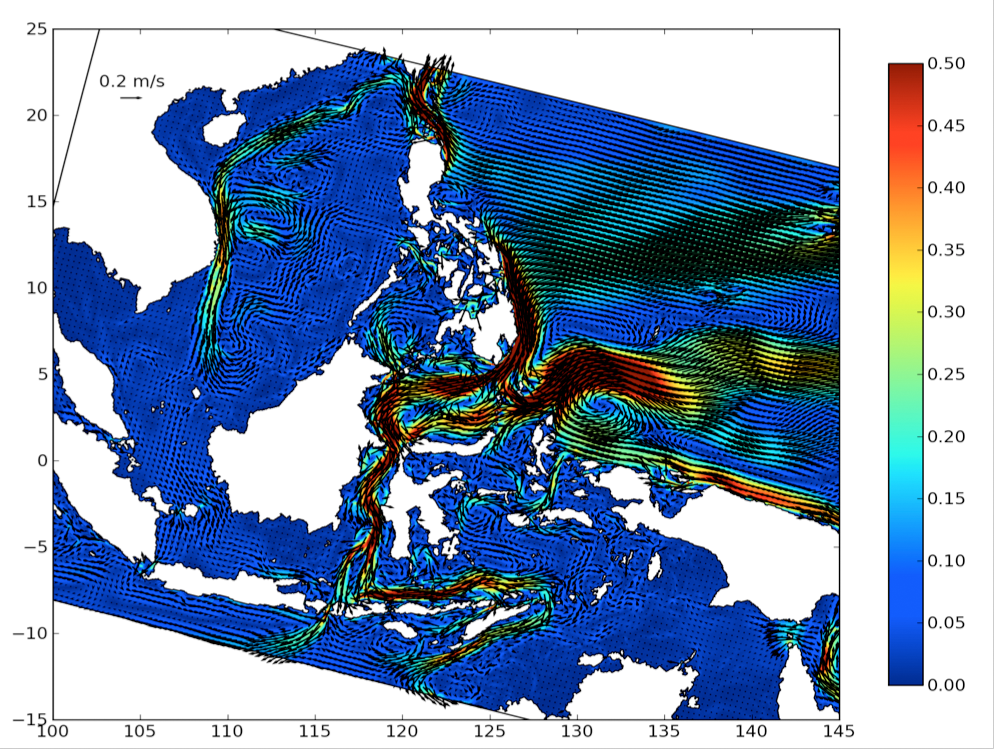
Download View Surface Currents: Mean near surface currents (depth averaged between the surface and 250 m depth) in ms-1 simulated by CT-ROMS over the 2004-2006 INSTANT period.
-
Download View Transports: Total mean volume transport in Sverdrup (SV, 1Sv = 106 m3 s-1) simulated by CT-ROMS (value on the left) and observed by INSTANT (value on the right) over 2004-2006. Negative transport is toward the Indian Ocean. Simulated transport is calculated for the full water column from sidewall to sidewall. The red lines indicated the transects used to diagnose the transport in the model.

-
Download View Finite-scale Lyapunov exponents (FSLE) animation: weekly FSLE spatial distribution computed forward in time from CT-ROMS surface velocity fields for the years 2004-2006. FSLEs are in units of day-1. (See Castruccio et al. 2013 for details). Mesoscale structures and vortices are clearly visible.
-
Download View Lagrangian particle tracking animation: particle release from multiple ecoregions, tracked for a period of 60 days.
3D Animations
Animations produced by Scott Pearse, NCAR's Visualization Lab
-
Download View YouTube Modelling the Indonesian Throughflow: 3D Visualization of particle dispersal within the Indonesian Throughflow, full annotated video/animation *5 min 54 sec
-
Download View Short 3D of Lifamatola Passage 3D Visualization of particle dispersal near Lifamatola Passage *35 sec
-
Download View Short 3D of Norther Great Barrier Reef: 3D Visualization of particle dispersal off the Northern Great Barrier Reef *24 sec